Use SPARKLINE to create 52-week range price indicator chart for stocks in Google Sheets
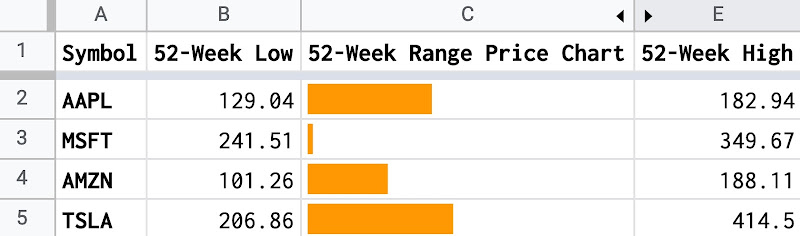
The 52-week range price indicator chart shows the relative position of the current price compared to the 52-week low and the 52-week high price. It visualizes whether the current price is closer to the 52-week low or the 52-week high price. In this post, I explain how to create a 52-week range price indicator chart for stocks by using the SPARKLINE function and the GOOGLEFINANCE function in Google Sheets.
