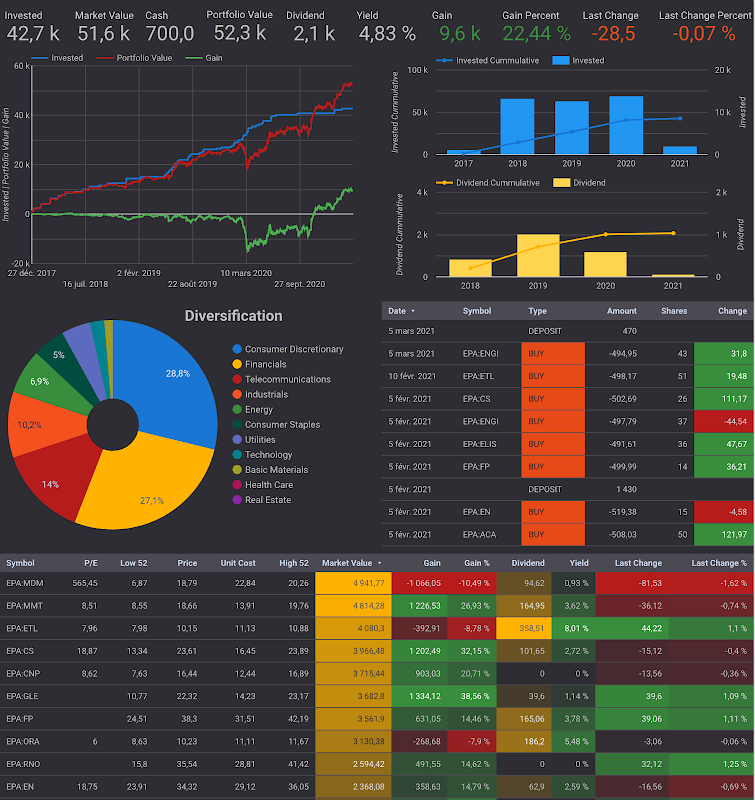
Create dividend income tracker with Google Data Studio

With transactions registered, it is easy to create a dividend income tracker with Google Sheets. However, a dividend income tracker in Google Sheets is not interactive. Instead of having different pivot tables and switching forth and back among them, I can create an interactive dividend income tracker with a single-page report on Google Data Studio. In this post, I explain how to create a dividend income tracker with Google Data Studio.