Create a dividend income tracker with Google Sheets by simply using pivot tables
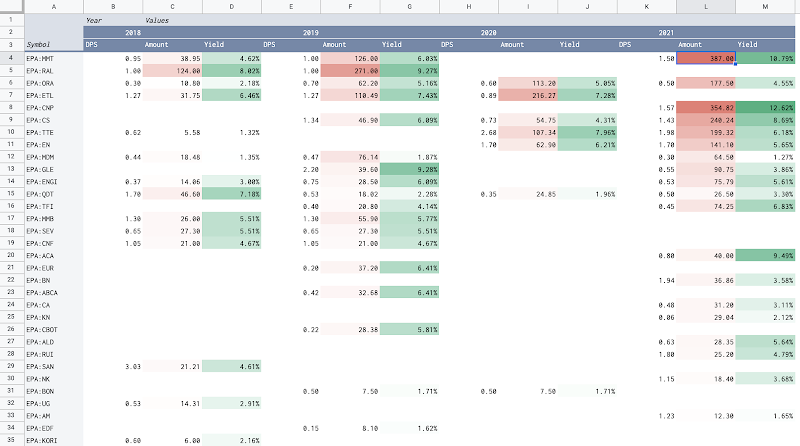
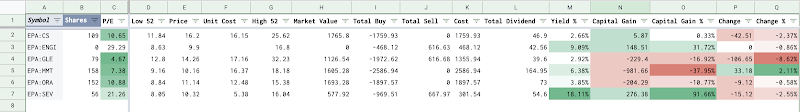
As my investment strategy is to buy stocks that pay regular and stable dividends during a long-term period, I need to monitor my dividends income by stocks, by months, and by years, so that I can answer quickly and exactly the following questions: How much dividend did I receive on a given month and a given year? How much dividend did I receive for a given stock in a given year? Have a given stock's annual dividend per share kept increasing gradually over years? Have a given stock's annual dividend yield been stable over years? In this post, I explain how to create a dividend tracker for a stock investment portfolio with Google Sheets by simply using pivot tables.