
Posts

Showing posts with the label Conditional Formatting
Stock Correlation Analysis With Google Sheets

Stock Correlation Analysis With Google Sheets

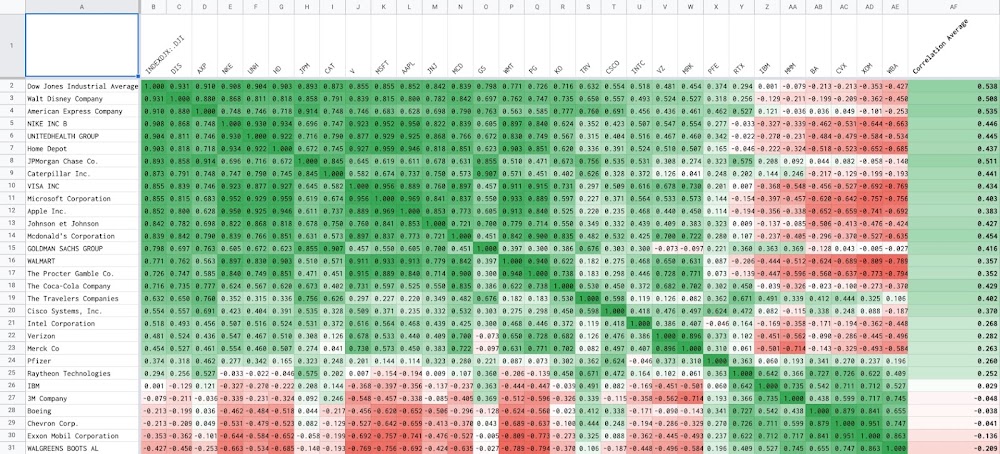
Correlation is a statistical relationship that measures how related the movement of one variable is compared to another variable. For example, stock prices fluctuate over time and are correlated accordingly or inversely to one another. Understanding stock correlation and being able to perform analysis are very helpful in managing a stock portfolio investment. In this post, I explain in details how to perform correlation analysis among stocks in Google Sheets.
Monitor stock investment portfolio with Pivot table and GOOGLEFINANCE function in Google Sheets

Monitor stock investment portfolio with Pivot table and GOOGLEFINANCE function in Google Sheets

As an investor, it is important to know the latest state of the stock portfolio. We need to know what stocks currently owned in the portfolio, how many shares for each one, how much dividend or gain contributed so far by each stock, etc. As we have registered stock transactions in a spreadsheet with Google Sheets, we can easily have the latest update from the stock portfolio by using pivot tables and GOOGLEFINANCE function.