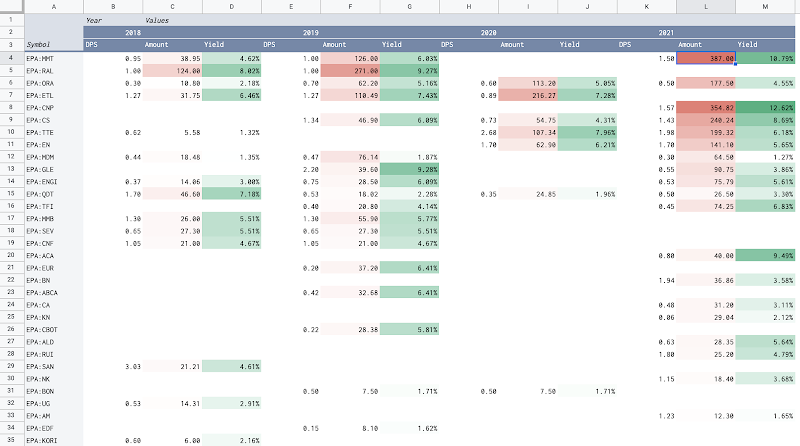
As my investment strategy is to buy stocks that pay regular and stable dividends during a long-term period, I need to monitor my dividends income by stocks, by months, and by years, so that I can answer quickly and exactly the following questions: How much dividend did I receive on a given month and a given year? How much dividend did I receive for a given stock in a given year? Have a given stock's annual dividend per share kept increasing gradually over years? Have a given stock's annual dividend yield been stable over years? In this post, I explain how to create a dividend tracker with Google Sheets. Manage stock transactions with Google Sheets Create dividend tracker with Google Sheets Track annual dividend amount of stocks Track dividend amount by month and by year Track annual dividend per share of stocks Track annual dividend yield of stocks Demo Conclusion References Manage stock transactions with Google Sheets I use a spreadsheet on Goo
Demo how to use XIRR and XNPV functions of Google Sheets to calculate internal rate of return (IRR) and net present value (NPV) for a stock portfolio
I have explained the idea of using Google Sheets functions to calculate internal rate of return (IRR) and net present value (NPV) for a stock portfolio . The process consists mainly of three steps: Identify cash flows from transactions managed in a Google Sheets spreadsheet Choose a discount rate based on personal preferences Apply XIRR and XNPV functions of Google Sheets In this post, I demonstrate step-by-step how to apply this process to calculate internal rate of return (IRR) and net present value (NPV) for a stock portfolio at 3 levels.