Create personal stock investment portfolio tracker with Google Sheets and Google Data Studio
The LION stock investment portfolio tracker is a personal stock investment portfolio tracker built with Google Sheets and Google Data Studio. The transactions of a stock investment portfolio are registered in Google Sheets. The tracker uses the GOOGLEFINANCE built-in function in Google Sheets to have the historical and current prices of stocks. The tracker has a small Google Apps Script program to do some complex computation, such as generating automatically the stock investment portfolio's daily change and comparing it with alternative investments. The stock investment portfolio is then visualized on a beautiful and interactive dashboard with Google Data Studio. This guide shows how to create a personal stock investment portfolio tracker with Google Sheets and Google Data Studio.

Table of Contents
Concept

A LION stock investment portfolio tracker consists of 3 main components: a spreadsheet in Google Sheets, a Google Apps-Script program in the same spreadsheet, and a dashboard in Google Data Studio.
-
In the spreadsheet, users need to insert data in 3 sheets: Configuration, Transactions, and Companies. The tracker will use data from these 3 sheets to measure the performance and the evolution of the stock investment portfolio. These measurements are stored in these others sheets: Overview, Values, Evolutions, Buy-Sell Evaluation, Benchmarks, and Symbols.
- The Configuration sheet contains settings for the stock investment portfolio tracker. Users can change the values of these parameters.
- The Transactions sheet contains transactions of the stock investment portfolio.
- The Companies sheet contains Name, Industry and Sector of the stocks presented in the portfolio. The information is not provided by the GOOGLEFINANCE function.
- The Values sheet presents the latest state for each stock presented in the portfolio.
- The Evolutions sheet contains the daily states of the portfolio from the first transaction date until today.
- The Buy-Sell Evaluation sheet contains data that helps to evaluate the efficiency of BUY and SELL transactions for a stock.
- The Benchmarks sheet contains data that helps to compare the stock investment portfolio with 2 alternative investments.
- The Symbols sheets contain historical prices of stocks. Each stock presented in the portfolio has its own historical prices sheet.
-
In the spreadsheet, there is a small Google Apps-Script program that can do some complex computations that are not feasible with the basic formulas of the spreadsheet. Most importantly, it helps to generate historical prices sheets for all stocks, compute the Evolutions, Buy-Sell Evaluation, and Benchmarks sheets. The script adds the menu LION stock investment portfolio Tracker to the spreadsheet's toolbar.
-
These sheets are connected as data sources to the dashboard in Google Data Studio. The dashboard has 5 pages: Overview, Diversification, Dividend, Buy-Sell Evaluations, and Benchmarks.
Demo
- LION stock investment portfolio Tracker - Spreadsheet
- LION stock investment portfolio Tracker - Dashboard
Who should use LION stock investment portfolio Tracker?
In making the LION stock investment portfolio tracker, I hope it can be useful for every investor. However, as I am an individual investor and my strategy is to invest in dividend-paying stocks in the long term, I think this stock investment portfolio tracker will best suit investors having a similar strategy. Although I have tried my best to make the LION stock investment portfolio tracker ready and easy to use for everyone, it might contain bugs or not suit all the needs. In case of problems, having basic skills with Google Sheets, Google Data Studio, and programming skills with Google Apps Script will be a big help. Those skills are also necessary if you want to customize the spreadsheet, the script, or the dashboard of the LION stock investment portfolio tracker.
Getting started
Make a copy of the spreadsheet
- Go to the spreadsheet in the demo section
- From the spreadsheet's toolbar:
- Click File menu
- Click Make a copy menu item
- In the copied spreadsheet, you will see the menu Lion stock investment portfolio Tracker on the spreadsheet's toolbar.
- The script is available in the copied spreadsheet. It is transparent and you can verify it.
- From the spreadsheet's toolbar:
- Click Tools menu
- Click Script editor menu item
- From the spreadsheet's toolbar:
Make a copy of the dashboard
- Go to your Google Data Studio home page
- From the Create button, create respectively 6 data sources to the 6 sheets of the copied spreadsheet: Transactions, Values, Benchmarks, Evolutions, Buy-Sell Evaluation, and Overview. You name the data source by the corresponding sheet's name.
- Go to the dashboard in the demo section
- From the dashboard's toolbar
- Click Make a copy of this report button
- A dialog will appear to ask for data sources. On the New Data Source side, you select the newly created data source that matches the one on the Original Data Source side.
- Click Copy Report button
How to use
- Set values for the parameters in the Configuration sheet, particularly for the Target Annual Rate and the Reference Index
- Run the Delete Historical Prices Sheets function to delete all sheets for the stocks of the sample portfolio
- In the Transactions sheet, replace sample transactions with your portfolio's transactions. You need to manually insert your transactions into this sheet or find a way to import them all at once.
- In the Companies sheet, replace sample data with those of stocks that you have purchased
- If you make a new transaction, add it to the Transactions sheet
- If you buy new stock for the first time:
- Update the Companies sheet for that new stock
- Run the Generate Historical Prices Sheet function from the menu to create a new historical prices sheet for that new stock
- Update the Values sheet for that new stock
- If there are stock splits after your transactions, you need to update the number of shares for old transactions accordingly, because the historical prices provided by GOOGLEFINANCE take into account those splits.
- Every day, to compute the portfolio's evolution with the latest stocks close prices:
- Run Generate Evolutions Sheet function
- Run Generate Buy-Sell Evaluation Sheet function
- Run Generate Benchmarks Sheet function
- You can schedule daily these executions with triggers
- The dashboard in Google Data Studio is refreshed regularly to visualize the most updated data. During the trading time, there are some delays with GOOGLEFINANCE.
- If you see something strange in data or charts, don't panic, take time to verify every sheet and try to debug the script.
Spreadsheet
The spreadsheet is used to register the stock investment portfolio's transactions. The stock investment portfolio's performance and evolution are computed and stored in the spreadsheet. This section explains how sheets are organized and the structure of each sheet.
Sheet Configuration
This sheet contains the settings of the stock investment portfolio tracker. The parameters that will be used by the script to compute other sheets. You can change the values of these parameters. NOTE: Do not change the names of these parameters!
| Parameter | Default value | Description |
|---|---|---|
| Date Format | dd/mm/yyyy | The format that will be applied to all generated columns of type DATE in the spreadsheet |
| Number Format | #,##0.000 | The format that will be applied to all generated columns of type NUMBER in the spreadsheet |
| Font Family | Inconsolata | The font family that will be applied to all generated sheets |
| Unknown Symbols | EPA:UG |
The list of symbols separated by commas for stocks that have been purchased in your portfolio but are not recognizable by the GOOGLEFINANCE function. GOOGLEFINANCE does not provide the historical prices for these stocks. Instead, you need to manually provide the historical price for these stocks during at least the period that you hold these stocks in your portfolio. These sheets must have 2 columns Date and Close. The script will not generate or delete historical prices sheets for these stocks. If you don't provide the historical prices for these stocks, the script will not compute your portfolio's evolution during the period that these symbols were hold in your portfolio. For example, I purchased the stock EPA:UG and had hold it for a while. The company has been merged with another company and its stock has changed to another name. I created manually the sheet EPA:UG and fill in manually the historical prices for EPA:UG. I then added EPA:UG to the list of Unknown Symbols. |
| Target Annual Rate | 0.05 |
Saving is the simplest alternative to stock investment. This parameter is the annual interest rate of saving that you want to achieve if you use deposited money for saving instead of buying stocks. The parameter will be used to generate the Benchmarks sheet. For example, I want my stock investment portfolio to grow about 5% a year, so I define here 0.05. |
| Reference Index | INDEXEURO:PX1 |
It is the symbol of the market index that you want to compare your portfolio against. The symbol must be recognizable by the GOOGLEFINANCE function, otherwise, you need to provide manually its historical prices sheet and add the symbol to the list of Unknown Symbols above. The parameter will be used to generate the Benchmarks sheet. For example, all my stocks are traded in the french stock market and I want to compare my stock investment portfolio with the french market index that is CAC40. So I define here INDEXEURO:PX1 that is the symbol of CAC40 and is recognizable by the GOOGLEFINANCE function. |
Sheet Transactions
This sheet registers your stock investment portfolio's transactions. You add a new line in the sheet when you buy/sell shares of a company, deposit/withdraw money, or receive dividends. Transactions are essential inputs to the stock investment portfolio tracker and will be used to compute other sheets.
| Column | Type | Description |
|---|---|---|
| Date | Date | Date when the transaction happened |
| Type | Text |
It can be one of the following values:
|
| Symbol | Text |
It is the symbol of the stock involved in the transaction.
|
| Amount | Number |
It is the money value of the transaction.
*Note*: A transaction's amount is supposed to include fees if applicable. |
| Shares | Number |
It is the number of shares of the stock involved in the transaction.
*Note*: If there are stock splits after your transactions, you need to update the number of shares for old transactions accordingly, because the historical prices provided by GOOGLEFINANCE take into account those splits. |
| Change | Formula |
It is the difference between the transaction's amount and the current market value for the number of shares involved.
The formula for this column on row 2 is: =IF(OR(B2="BUY",B2="SELL"),GOOGLEFINANCE(C2)*E2+D2,"")
|
| Industry | Formula |
It is the industry of the stock involved in the transaction.
The formula for this column on row 2 is: =IF(ISBLANK(C2),"",VLOOKUP(C2,Companies!A:D,3,FALSE))
|
| Sector | Formula |
It is the sector of the stock involved in the transaction.
The formula for this column on row 2 is: =IF(ISBLANK(C2),"",VLOOKUP(C2,Companies!A:D,4,FALSE))
|
Note: As a dividend can be paid in stock or in cash, to keep it simple and compatible with the transaction's structure above:
- If a dividend is paid in stock, it can be represented as a BUY transaction with amount = 0 and shares > 0. It is considered as getting shares for free.
- If a dividend is paid in cash, it can be represented as a DIVIDEND transaction with amount > 0, and shares > 0, but it does not mean more shares are added to the portfolio for this stock. It helps to know the amount of dividend for each share.
Sheet Companies
This sheet contains information about the Name, Industry, and Sector of stocks that you have purchased. The information will help to analyze your portfolio's diversification. You need to manually provide the information because they are not available through the GOOGLEFINANCE function.
Sheet Overview
This sheet contains the main indicators about your stock investment portfolio. These indicators are computed by applying basic formulas on the Transactions and Values sheets data. These indicators will be displayed as scorecards in the dashboard.
| Column | Description |
|---|---|
| Deposit |
The total amount of DEPOSIT transactions =SUMIF(Transactions!B:B,"DEPOSIT",Transactions!D:D)
|
| Withdrawal |
The total amount of WITHDRAWAL transactions =SUMIF(Transactions!B:B,"WITHDRAWAL",Transactions!D:D)
|
| Invested |
The total amount of DEPOSIT and WITHDRAWAL transactions =A2-B2
|
| Cash |
The total amount of all transactions =SUM(Transactions!D:D)
|
| Market Value |
The total market value of currently holding stocks based on their latest close prices =SUM(Values!O:O)
|
| Portfolio Value |
The sum of the market value and the available cash =D2+E2
|
| Dividend |
The total amount of DIVIDEND transactions =SUMIF(Transactions!B:B,"DIVIDEND",Transactions!D:D)
|
| Yield |
The ratio between the dividend amount and the invested amount =G2/C2
|
| Gain |
The difference between the portfolio value amount and the invested amount =F2-C2
|
| Gain Percent |
The ratio between the gain amount and the invested amount =I2/C2
|
| Last Change |
The change of market value compared to the previous trading day's closes =SUM(Values!T:T)
|
| Last Change Percent |
The ratio between the last change amount and the invested amount =K2/C2
|
Sheet Values
This sheet computes the latest state for all stocks you have purchased. This sheet is the pivot table of the Transactions sheet. The first two columns Symbol and Shares are generated by the pivot table function. These other columns are computed with basic formulas. If you purchase a new stock for the first time, you need to update the sheet by dragging the formulas of columns on row 2 to other rows.
| Column | Description |
|---|---|
| Symbol | The symbol of the stock, generated by the pivot table. |
| Shares | The total number of shares of BUY and SELL transactions of the stock, computed by the pivot table. |
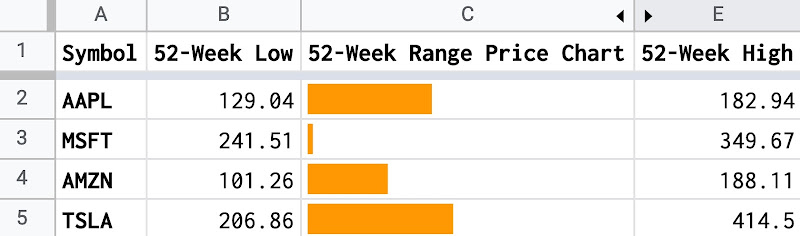
| Low52 |
The stock's 52-week low price, provided by GOOGLEFINANCE. The formula for this column on row 2 is: =GOOGLEFINANCE(A2, "low52")
|
| Price |
The stock's current price, provided by GOOGLEFINANCE. The formula for this column on row 2 is: =GOOGLEFINANCE(A2)
|
| High 52 |
The stock's 52-week high price, provided by GOOGLEFINANCE. The formula for this column on row 2 is: =GOOGLEFINANCE(A2, "high52")
|
| Change |
The price change since the previous trading day's close, provided by GOOGLEFINANCE. The formula for this column on row 2 is: =GOOGLEFINANCE(A2, "change")
|
| Change Percent |
The percentage change in price since the previous trading day's close, provided by GOOGLEFINANCE. The formula for this column on row 2 is: =GOOGLEFINANCE(A2, "changepct")/100
|
| P/E |
The price/earnings ratio, provided by GOOGLEFINANCE. The formula for this column on row 2 is: =IFERROR(GOOGLEFINANCE(A2,"pe"),"")
|
| Market Capitalization |
The market capitalization of the stock, provided by GOOGLEFINANCE. The formula for this column on row 2 is: =GOOGLEFINANCE(A2, "marketcap")
|
| Total Buy |
The total amount of BUY transactions for the stock. The formula for this column on row 2 is: =SUMIFS(Transactions!D:D,Transactions!B:B,"BUY",Transactions!C:C,A2)
|
| Total Sell |
The total amount of SELL transactions for the stock. The formula for this column on row 2 is: =SUMIFS(Transactions!D:D,Transactions!B:B,"SELL",Transactions!C:C,A2)
|
| Invested |
The absolute value of the total buy amount. The formula for this column on row 2 is: =ABS(J2)
|
| Current Cost |
The sum of the total buy amount and the total sell amount for the stock. It is only applicable for stocks whose number of shares in your portfolio is greater than 0. The formula for this column on row 2 is: =IF(B2>0,ABS(J2+K2),"")
|
| Current Unit Cost |
The cost per share for the stock. It is only applicable for stocks whose number of shares in your portfolio is greater than 0. The formula for this column on row 2 is: =IF(B2>0,M2/B2,"")
|
| Market Value |
The market value for the stock. The formula for this column on row 2 is: =IF(B2>0,B2*D2,0)
|
| Dividend |
The total dividend amount received by owning the stock. The formula for this column on row 2 is: =SUMIFS(Transactions!D:D,Transactions!B:B,"DIVIDEND",Transactions!C:C,A2)
|
| Yield |
The ratio between the dividend amount and the invested amount for the stock. The formula for this column on row 2 is: =P2/L2
|
| Gain |
The sum of the total buy amount, the total sell amount and the current market value for the stock. The formula for this column on row 2 is: =J2+K2+O2
|
| Gain Percent |
The ratio between the gain amount and the invested amount for the stock. The formula for this column on row 2 is: =R2/L2
|
| Total Last Change |
The last change for all holding shares of the stock. The formula for this column on row 2 is: =IF(B2>0,F2*B2,0)
|
| Last Change Percent |
The percentage change in price since the previous trading day's close. The formula for this column on row 2 is: =G2
|
| Name |
The name of the stock. The formula for this column on row 2 is: =VLOOKUP(A2,Companies!A:D,2,FALSE)
|
| Industry |
The industry of the stock. The formula for this column on row 2 is: =VLOOKUP(A2,Companies!A:D,3,FALSE)
|
| Sector |
The sector of the stock. The formula for this column on row 2 is: =VLOOKUP(A2,Companies!A:D,4,FALSE)
|
Sheet Evolutions
This sheet contains data about the portfolio's evolution from the first transaction date until today. The sheet is computed and generated by the script's function Generate Evolutions Sheet.
| Column | Description |
|---|---|
| Date | Starting from the first transaction date until today. |
| Invested | The total amount of money has been invested until the date. It is the sum of amount of DEPOSIT and WITHDRAWAL transactions that have been made until the date. |
| Cash | The available money in the portfolio on the date. It is the sum of amount of all transactions that have been made until the date. |
| Market Value | The total market value for all holding stocks in the portfolio on the date based on their close prices on the date. From the transactions that have been made until the date, the script computes the number of shares for stocks in the portfolio and then multiply with their close prices on the date. |
| Portfolio Value | The sum of the cash amount and market value amount on the date. |
| Gain | The difference between the portfolio value and the invested amount on the date. |
| Gain Percent | The ratio between the gain amount and the invested amount on the date. |
Sheet Buy-Sell Evaluation
This sheet contains data that helps to evaluate the efficiency of each BUY and SELL transaction for a stock. The sheet aggregates all historical prices sheets of all stocks presented in the portfolio. The unit amount for each share of stock in BUY and SELL transactions is presented along with its historical prices. The idea is to evaluate if a BUY or SELL transaction was made at the right moment and to make improvements for future transactions.
| Column | Description |
|---|---|
| Symbol | The symbol of stock presented in the portfolio. |
| Date | Each stock has its own date range that starts from the first transaction date until today. |
| Close | The stock's close price on that date. |
| Unit Cost | The stock's unit cost if it is still being held in the portfolio on that date. It is computed by divide the total amount of BUY and SELL transactions of the stock until that date by the number of shares of the stock in the portfolio on that date. |
| Unit Buy | The unit amount for each share of the stock if a BUY transaction was made on that date |
| Unit Sell | The unit amount for each share of the stock if a SELL transaction was made on that date |
| Dividend Per Share | The unit amount for each share of the stock if a DIVIDEND transaction was made on that date. |
| Value | The market value for holding shares of the stock based on its close price on the date. |
| Cost | The total amount of BUY and SELL transactions for the stock until the date if the stock was still being held in the portfolio on that date |
Sheet Benchmarks
This sheet compares the stock investment portfolio's evolution with 2 alternative investments:
- One alternative investment is to put money in a saving account with compound interest. The annual saving interest rate is defined in the Configuration sheet. The idea is that the amount of a DEPOSIT transaction today, for example, will generate daily interest from tomorrow. And the interest generated for today will generate interest for tomorrow. For each day from the first transaction date until today, the script computes the Saving Interest, Saving Balance, Saving Gain, and Saving Gain Percent on that date.
- Another alternative investment is to invest only in a market index. The Reference Index is defined in the Configuration sheet. The idea is that the close price of the chosen index on the first transaction date is used as the reference price. For each day from the first transaction date until today, the script computes the change in percent of the market index's close price on that date with the reference price on the first transaction date.
| Column | Description |
|---|---|
| Date | Starting from the first transaction date until today |
| Cashflow | The total amount of DEPOSIT and WITHDRAWAL transactions made ON the date |
| Invested | The total amount of DEPOSIT and WITHDRAWAL transactions have been made UNTIL the date |
| Saving Interest | The daily interest generated with the saving balance of the previous day |
| Saving Balance | The sum of the saving balance on the previous day, the cashflow of the date and the saving interest of the date |
| Saving Gain | The total cumulative saving interest until the date |
| Saving Gain Percent | The ratio between the saving gain and the invested |
| Portfolio Value | The sum of the portfolio's available cash and its holding stocks' market value on the date |
| Portfolio Gain | The difference between the portfolio value and the invested amount in the portfolio on the date |
| Portfolio Gain Percent | The ratio between the portfolio gain and the invested amount in the portfolio on the date |
| Reference Index Price | The reference market index's close price on the date |
| Reference Index Change Percent | The change in percent of the market index's close price on that date with its close price on the first transaction date |
Sheets Historical Prices of Stocks
Each stock presented in the portfolio has its own sheet containing its historical prices from the first transaction date of the portfolio until today. A sheet's name is a stock's symbol. Each sheet contains only 2 columns that are Date and Close.
For example, the symbol EPA:ENGI involved in the sample portfolio's transactions, its historical prices sheet is necessary for the LION scripts. A sheet named EPA:ENGI is generated. The formula =GOOGLEFINANCE("EPA:ENGI", "price", DATE(2017,12,27), TODAY(), "DAILY") is set on the cell A2. The formula creates 2 columns that are Date and Close.
Theses sheets are generated by the function Generate Historical Prices Sheets below. These sheets are hidden by default and it is possible to show/hide them with the functions Show Historical Prices Sheets and Hide Historical Prices Sheets.
Menu Lion stock investment portfolio Tracker
| Menu Item | Description |
|---|---|
| Generate Historical Prices Sheets | This function will generate for each symbol found in the Transactions sheet a sheet that contains the stock's historical prices from the first transaction date until today. The sheet's name is the stock's symbol. If you buy a stock for the first time, you need to run this function. |
| Delete Historical Prices Sheets | This function will delete existing historical prices sheets for all symbols found in the Transactions sheet. You can run this function to reinitialize the spreadsheet if you think something doesn't work as expected. |
| Show Historical Prices Sheets | By default, historical prices sheets are hidden. If you want to verify those sheets, you can run this function to show them. You can also see them in the menu View -> Hidden Sheets |
| Hide Historical Prices Sheets | This function will hide historical prices sheets for all symbols found in the Transactions sheet. |
| Update Values Sheet | If you buy a new stock for the first time, the pivot table adds a new line in the Values sheet. You can run this function to apply formulas to the new line in the Values sheet. |
| Generate Evolutions Sheet | This function uses the Transactions sheet and all historical prices sheet to compute the portfolio's evolution from the first transaction date until today. The data is then written to the Evolutions sheet. |
| Generate Buy-Sell Evaluation Sheet | This function uses the Transactions sheet and all historical prices sheet to compute data for the Buy-Sell Evaluation Sheet. |
| Generate Benchmarks Sheet | This function uses the values of Target Annual Rate and Reference Index parameter that are defined in the Configuration sheet to compute data for the Benchmarks Sheet. The Benchmarks Sheet helps to compare your stock investment portfolio with 2 alternative investments. One alternative investment is to invest in a market index. Another alternative investment is to save money with a target annual compound interest rate. |
| Clear All Caches | The parameters in the Configuration sheet are cached to help improving the performance of scripts. If you change the values of these parameters, you need to run this function firstly so that the next executions of others functions will use the new values of these parameters. |
Triggers
To keep track closely the portfolio's evolution, you need to run the 3 functions Generate Evolutions Sheet, Generate Buy-Sell Evaluation Sheet, and Generate Benchmarks Sheet every day. You can automate these tasks by scheduling them with triggers. You can create 3 triggers for the 3 functions generateEvolutionsSheet, generateBuySellEvaluationSheet, and generateBenchmarksSheet that will execute them every day at about 7 am before the market's opening.
- Go to the copied spreadsheet
- Go to the script editor
- From the spreadsheet's toolbar:
- Click Tools menu
- Click Script editor menu item
- From the spreadsheet's toolbar:
- Select the menu Triggers on the left side panel of the script editor
- Click the button + Add Trigger
- Choose generateEvolutionsSheet for the select Choose which function to run
- Choose Time-driven for the select Select event source
- Choose Day timer for the select Select type of time based trigger
- Choose 6am to 7am for the select Select time of day
- Save the trigger
- Create two other triggers for generateBuySellEvaluationSheet and generateBenchmarksSheet
Dashboard
The dashboard is built with Google Data Studio. It has 5 pages: Overview, Diversification, Dividend, Buy-Sell Evaluations, and Benchmarks. The data to visualize are fetched from the above sheets via a built-in connector of Google Data Studio. This section explains how each page of the dashboard is designed and how to use them to track the stock investment portfolio.
Data sources
The dashboard of LION stock investment portfolio trackers needs 6 data sources corresponding to 6 sheets: Transactions, Values, Benchmarks, Evolutions, Buy-Sell Evaluation, and Overview. Each page of the dashboard contains many charts and each chart uses data from one data source.
Page Overview
This page shows an overview about the stock investment portfolio.

| Chart | Description |
|---|---|
| Scorecards |
It displays the indicators computed in the sheet Overview:
|
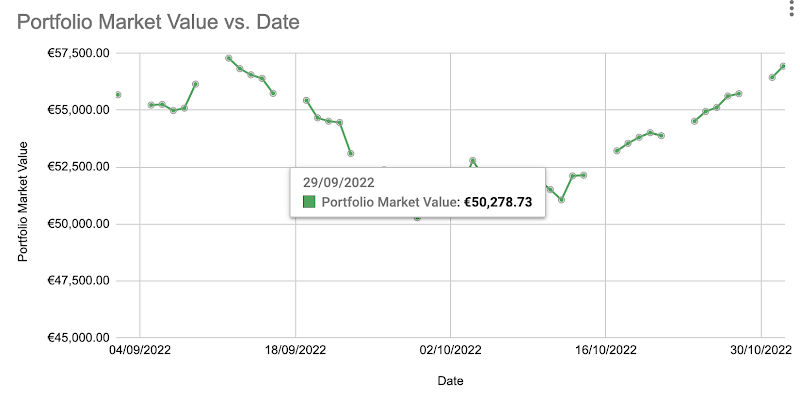
| Invested / Portfolio Value / Gain time series | Present the portfolio's evolution since the first transaction date. It uses the Evolutions sheet's data |
| Invested and Dividend time series |
The 2 charts use Transactions sheet's data. |
| Diversification pie chart | Present the distribution of market value by industry. It uses the Values sheet's data. |
| Transactions table |
Present the Transactions sheet's data. |
| Values table | Present the Values sheet's data. |
Page Diversification
This page shows the diversification of the stock investment portfolio by industry, by sector, and by stock.

| Column | Description |
|---|---|
| Avg P/E | The average P/E of the portfolio's stocks that are under the industry or the sector |
| Market Value | The total market value of the portfolio's stocks that are under the industry or the sector |
| Market Value Part | The percentage of the market value for the industry, the sector or the stock compared to the portfolio's total market value |
| Dividend | The total dividend of the portfolio's stocks that are under the industry or the sector |
| Dividend Part | The percentage of the dividend for the industry, the sector or the stock compared to the portfolio's total dividend |
| Gain | The total gain of the portfolio's stocks that are under the industry or the sector |
Page Benchmarks
This page compares the stock investment portfolio with 2 alternative investments: a saving account with compound interest and a reference market index. The table below explains briefly what data are visualized on this page. For a more detailed explanation of the 2 benchmarks, you can read these two posts:
- Compare stock investment portfolio to compound interest saving account
- Compare stock investment portfolio to market indexes

| Chart | Description |
|---|---|
| Invested / Portfolio Value / Saving Balance time series chart |
It compares the evolutions of the 3 values since the first transaction date.
|
| Portfolio Gain / Saving Gain time series chart |
It compares the evolutions of the 2 values since the first transaction date.
|
| Portfolio Gain Percent / Saving Gain Percent / Reference Index Change Percent time series chart |
It compares the evolutions of the 3 values since the first transaction date.
|
Page Dividend

This page helps to track the dividend income of the stock investment portfolio.
| Chart | Description |
|---|---|
| Dividend scorecards |
|
| Dividend time series chart | The chart compares the dividend income between this year and the last year. On the chart, you should hope to see the dividend income of this year is higher than last year. |
| Dividend by year and by month table | The heat map table presents the distribution of dividends on each month and each year. It helps to manage the regularity of receiving dividends. |
| Dividend by year and by industry / symbol | The heat map table presents the distribution of dividends of each industry/symbol and each year. It helps to manage the diversification of dividend income. |
Page Buy-Sell Evaluation
This page helps to evaluate the buy and sell transactions for the portfolio's stocks.

| Chart | Description |
|---|---|
| Symbol selector | This selector allows selecting only one symbol at a time among all symbols presented in the portfolio. |
| Date range selector | This selector allows focusing on a specific period instead of the default period, which is started from the first transaction date until today. |
| Indicators table | The table presents main indicators about the symbol. These indicators are extracted from the Values sheet. |
| Trending charts | The two time series chart present the trending of the selected symbol and the portfolio gain during the last 90 days. The charts help to evaluate the recent correlation between the selected symbol and the portfolio. The charts are not controlled by the date range selector above. |
| Close / Unit Cost / Unit Buy / Unit Sell / Dividend Per Share time series chart | This chart presents the BUY, SELL, and DIVIDEND transactions along with the historical prices of the selected symbol. It helps to evaluate whether a BUY or SELL transaction was made at the right moment. The chart starts from the first transaction date until today. It uses the BUY-SELL Evaluation sheet's data. |
| Value / Cost time series chart | This chart presents the evolutions of the market value and the cost for the selected symbol. If the Value line is above the Cost line, the investment on the selected symbol is making money, otherwise, it is losing money. The chart starts from the first transaction date until today. It uses the BUY-SELL Evaluation sheet's data. |
| Transactions table | This table presents the transactions of the selected symbol. By default, the transactions are sorted by date descending. |
FAQ
getHistoricalPricesBySymbol - TypeError: Cannot read property 'getRange' of null

It seems like the historical prices sheet for a symbol is not yet correctly generated.
- Verify whether all symbols in your transactions have their historical prices sheets generated. Normally, those sheets are hidden by default. Please refer to these 2 sections Sheets Historical Prices of Stocks and Menu Lion stock investment portfolio Tracker
- Otherwise, you can add a breakpoint at the beginning of function getHistoricalPricesBySymbol(symbol) and find out which symbol is having problem.
What to do in case a stock changes its symbol?
If a stock changes symbol, GOOGLEFINANCE function will only return data for the new symbol and not return any data to the old symbol. Consequently, if you had made transactions of that stock before the symbol change, you need to update the Symbol of those transactions into the new symbol.
For example, Total company (EPA:FP) has recently renamed itself as TotalEnergies (EPA:TTE). As the result, I need to update all transactions of EPA:FP to EPA:TTE.
How to manage stock splits in Google Sheets
If a split happens to a stock, GOOGLEFINANCE function will reflect that split to the historical prices of that stock. Consequently, if you had made transactions of that stock before the split, you need to update the Shares of those transactions in accordance to the split.
For example, I had bought 1 share of Dassault Aviation company (EPA:AM) and received 1 dividend payment before the company announced a split ten-for-one on October, 1st 2021. As the result, I need to update previous transactions related to the EPA:AM stock by changing the number of shares from 1 to 10.
Before the ten-for-one split:
| Date | Type | Symbol | Amount | Shares |
|---|---|---|---|---|
| 18/05/2021 | DIVIDEND | EPA:AM | 12.30 | 1 |
| 13/10/2020 | BUY | EPA:AM | -744.92 | 1 |
After the ten-for-one split:
| Date | Type | Symbol | Amount | Shares |
|---|---|---|---|---|
| 18/05/2021 | DIVIDEND | EPA:AM | 12.30 | 10 |
| 13/10/2020 | BUY | EPA:AM | -744.92 | 10 |
How to manage dividend payments with option of receiving new shares
I have experienced many times when a company pays dividends and proposes to the shareholders an option of receiving the payment: by shares or by cash. For example, on May 2019, I had 18 shares of Société Générale (EPA:GLE). The company distributed a dividend of 2.20 euros per share with two options: by cash or by shares at the price of 22.31 euros. I decided to receive the dividend payment in form of shares. With 18 shares, my dividend payment was valued at 39.60 euros and that was not enough for 2 shares. I hence paid an additional amount to compensate. I registered then the operation as 2 transactions: one DIVIDEND transaction and one BUY transaction.
| Date | Type | Symbol | Amount | Shares |
|---|---|---|---|---|
| 31/05/2019 | BUY | EPA:GLE | -44.62 | 2 |
| 31/05/2019 | DIVIDEND | EPA:GLE | 39.60 | 18 |
Conclusion
I hope that you have succeeded in building your personal stock investment portfolio tracker with Google Sheets and Google Data Studio by following this guide.
Disclaimer
The post is only for informational purposes and not for trading purposes or financial advice.
Feedback
If you have any feedback, question, or request please:
- leave a comment in the comment section
- write me an email to allstacksdeveloper@gmail.com
Support this blog
If you value my work, please support me with as little as a cup of coffee! I appreciate it. Thank you!

Share with your friends
If you read it this far, I hope you have enjoyed the content of this post. If you like it, share it with your friends!


Hi,
ReplyDeleteit looks great! Thank you! It is working great with different stocks, but what about ETF?
They have a lot of industries and sectors in one ETF. How is it possible to see a nice diversification chart all over stocks and ETF's ? Country diversification chart would be also very nice.
Hi Mike,
DeleteIf you can fetch data about the industries and sectors of ETFs, it's totally possible to create a nice diversification chart for both stocks and ETFs. However, it might require many efforts to accomplish.
Thank you for the suggestion about diversification by geography. I'll look into it.
When using your sheet, I get an error "TypeError: aDate.getFullYear is not a function" when generating the sheet. This happens in the Evolutions and the Buy-Sell Evaluations sheet. The Benchmark sheet works fine.
ReplyDeleteAt first it worked fine, however after I have removed your transcations and companies and replaced them with a couple of my own I now get this error.
Can you assist ?
I doubt that some dates that you enter in the Transactions tab are not recognized as type Date.
DeleteYou can double click on any date that you entered in the column Date of the Transactions tab, you should expect to see a calendar popup that allows you to select a date.
If the calendar popup does not appear, that means your input is not a valid Date type.
I had the same error as Thomas and as you said It was because of the Date format in the Transactions sheet. I have been able to solve it by doing:
Delete1) Select whole A column in Transactions sheet
2) Click on Format->Number-> Personalized format number
3) Select yyyy-mm-dd
4) By doing this I was able to identify which cells where not identified as Date format and I changed them
After this the problem dissapeared.
Yes, that's exactly what I meant. Thank you for your detailed feed back!
DeleteHi,
ReplyDeleteI'm having trouble with the data sources in my copied report.
After making a copy of the LION Stock Portfolio Tracker - Spreadsheet as described, I went to the LION Stock Portfolio Tracker - Dashboard and followed the steps to click to make a copy of the Dashboard report.
A dialog did appear to ask for data sources and, on the New Data Source side there were drop-down options matching each of the spreadsheet tabs, but on the Original Data Source side each one showed as "Unknown", so I wasn't sure what I was matching.
I tried to match them up as per the list in the docs (i.e. Transactions, Values, Benchmarks, Evolutions, Buy-Sell Evaluation, and Overview) and this worked for some sections of the report (e.g. the Diversification section), but most parts showed an error.
Any suggestions as to what I might be doing wrong?
Thanks.
Hi,
DeleteThank you for your feed back. Yes, you're right about the "Unknown" on the Original Data Source side. I also see that if I use a different Google account to make a copy. I look into it to improve the guide.
Can you try to make a another copy, and select your sources in the order (top to bottom): Overview, Evolutions, Values, Transactions, Benchmarks, Buy-Sell Evaluation?
Thanks.
Fantastic, selecting the data sources in the order you suggested worked!
DeleteThanks for your help.
That's great! Thanks again for your feedback.
DeleteHey man, the tracker works beautifully, but I'm having a hard time figuring this out: I sold all my stocks from a given ticker (VOO), but the Values Sheet still shows a positive number of shares instead of zero. This is affecting the Market Value and Current Unit Cost cells, thus also affecting my total portfolio gain (making it spike after the SELL transaction). Any idea of what this might be about? Thanks, bought you a coffee!
ReplyDeletePS: I tried the Uptade Values Sheet button, didn't solve it.
DeleteFor the SELL transactions, did you input a negative number to the Shares column?
DeleteOn the Transactions sheet, if you sum Shares of all BUY and SELL transactions for that VOO stock, do you have 0?
If you have 0 but the Values sheet shows a positive number, please check the Filters in the Pivot table editor on the Values sheet. This Values sheet should accept only BUY and SELL transactions.
Oops, that was it. Thanks man!
DeleteGreat! Glad it helped!
DeleteThis comment has been removed by the author.
ReplyDeleteYes you can.
DeleteYou need to modify slightly the apps script function generateHistoricalPricesSheets by providing it which stocks that you want to generate daily prices.
You can take a look at my other post "Stock Correlation Analysis With Google Sheets" for a sample.
https://www.allstacksdeveloper.com/2021/08/stock-correlation-analysis-with-google-sheets.html
This comment has been removed by the author.
Delete1. If you use this stock portfolio tracker spreadsheet as it is, you can choose your own benchmark index by changing the value of "Reference Index" in the "Configuration" sheet. The default value is "INDEXEURO:PX1" which is the CAC40 index for the french market. However, please note that you can only compare your stock portfolio performance to only one market index within this stock portfolio tracker spreadsheet.
DeleteFor more details, please refer to these sections:
- https://www.allstacksdeveloper.com/p/lion-stock-portfolio-tracker.html#sheet-benchmarks
- https://www.allstacksdeveloper.com/p/lion-stock-portfolio-tracker.html#sheet-configuration
2. If I understand correctly, you might want to compare your stock portfolio performance to many market indexes. In that case, you can check out my post "Compare stock portfolio to market indexes" where I explain how to compare a stock portfolio to market indexes by using Google Sheets, Apps Script, and Google Data Studio. I hope it can help you.
https://www.allstacksdeveloper.com/2021/03/compare-stock-portfolio-to-market-indexes.html
More of a conceptual question, sorry if this is basic stuff: my Overview sheet shows a 14,2k deposit, no withdrawals, market value of 12,6k, portfolio value of 14,4k and cash=1,7k. I'm having a hard time to understand how can my portfolio value have increased if the market value is below the amount that I invested. Any thoughts? Thanks!
ReplyDeletePortfolio Value (14.4K) = Market Value (12.6K) + Cash (1.7K). It seems correct, doesn't it? If you want more precise number, you can format to add more number after the point (comma).
DeleteInvested = Deposit - Withdraw
Gain = Portfolio Value - Invested = Market Value + Cash - (Deposit - Withdraw) = 12.6 + 1.7 - (14.2 - 0) = 14.4 - 14.2 = 0.2K
So if you have deposited so far 14.2K and have not withdrawn any, it means your portfolio is making a gain of 14.4K - 14.2K = 0.2K. You can verify your transactions one by one to verify.
"I'm having a hard time to understand how can my portfolio value have increased if the market value is below the amount that I invested". => Because you have 1.7K available cash in your portfolio. If you spend 1.7K to buy stocks, your market value will be 14.4K and cash will be 0.
Thanks man, what I did wrong was forgetting to convert my native currency to US dollars in a DEPOSIT transaction, thus showing this cash I don't actually have, and throwing everything off. All clear, thanks!
DeleteThanks for your feedback. It's good to know that.
DeleteHi, thank you!
ReplyDeleteWhile running Portfolio Tracker - Generate Buy Sell Evaluation Sheet got Error:
TypeError: Cannot read property 'activate' of null at generateBuySellEvaluationSheet(Code:457:15)
Any ideas what is wrong?
Hi, Sorry for a late reply but with the information provided, I can't really help you. However you can perform a debug process by your own within Apps Script. You can debug step by step to find out what is wrong. Hope that helps you!
DeleteHi, I have some problem with the "Current Unit Price" formula, as it is calculated by summing the sell and buy (negative and positive). The problem is when I buy a stock, say the code is IDX:ADRO and I have sold it, then I rebuy again, the unit price is not correct as it is summing the old stocks which I have sold already. Thanks
ReplyDeleteI suggest to use extra category out of BUY, SELL, DIVIDEND, DEPOSIT, you can say as DIFFERENCE/PROFIT/LOSS (SELL PRICE - BUY PRICE), this is as the result of realization action. Then in the formula we can use sum of BUY + SELL - DIFFERENCE/PROFIT/LOSS and then you can divide with the available stock on hand. Of course there are plenty of solution, if you could share, it would be very nice.
DeleteHi, I think what you want here is to calculate unit cost based on FIFO (first in first out) accounting method.
DeleteI have already had some thoughts about that but it's quite complicate to implement with Google Sheets. That's why I use the "normal" method here.
I look into it and see what solution I can come up with. If I happen to find the solution, I'll surely share it with you here on this blog.
Thank you for your feedback.
I would like to let you know that I just published the post about "Use the FIFO method in Google Sheets to compute the cost basis of a stock portfolio investment"
Deletehttps://www.allstacksdeveloper.com/2022/09/fifo-stock-portfolio-google-sheets.html
I hope that you can find it useful.
So I put the formula for current unit cost as =IF(B2>0,(ABS(J2+K2)+SUMIFS(Transactions!D:D,Transactions!B:B,"DIFF",Transactions!C:C,A2)),""), i used the term "DIFF". and I also need to change the Gain formula to =J2+K2+O2-SUMIFS(Transactions!D:D,Transactions!B:B,"DIFF",Transactions!C:C,A2), so far so good, but Correct me if I am wrong
ReplyDeleteI think you shall include some terminology of Open and Closed position, Like Gain of 1 stock Open and included closed position.
DeleteWould you mind to send me a screen capture of what you have changed to my email allstacksdeveloper@gmail.com?
DeleteHi again, for the problems above I have managed to debug them, however I have script problem. Since i am using IDX:COMPOSITE, which has different time zone, when I generate the data from GOOGLEFINANCE always pushed to 1 day after the start date. I tried using INDEXEURO:PX1, it is fine. Can you modify your script to make it 1 day earlier than the reference start date when generating the data from GOOGLEFINANCE. since I dont understand the language.
ReplyDeleteIf you have finished it, can you copy paste it in here the modified codes.
I suppose it is related to this section
------* Get the first transaction date from the sheet Transactions. ----
Thanks
What are the "problems above" that you refer to please? I might miss something here?
DeleteAre you trading stocks on different markets and hence different time-zones?
"Since i am using IDX:COMPOSITE, which has different time zone, when I generate the data from GOOGLEFINANCE always pushed to 1 day after the start date."
=> Is that something that GOOGLEFINANCE does particularly for IDX:COMPOSITE or Indonesian market?
Hey, I might have an idea.
Delete- If you make a copy of my spreadsheet, it might still use the Paris time zone.
- And then you insert your transactions. The dates of your transactions are considered at Paris time zone.
- Your stocks are traded on the Indonesian market.
- GOOGLEFINANCE returns the historical prices for Indonesian stocks with Indonesian timezone
- Consequently, there is a mismatch of timezones
In that case, please try to change the time zone settings for your spreadsheet. You find the documentation here https://support.google.com/docs/answer/58515?hl=en&co=GENIE.Platform%3DDesktop#zippy=%2Cchange-locale-and-time-zone
Please try it and re-run the computation to see if it resolve your problem.
Hi, I followed your suggestion, the generated data in the price historical is fine but when I run the evolution script, first date appeared to be missing and only shows the repetition of the table header, but the second date up to end are fine. If i open the date with time, in the Evolution sheet the default time is 0.00.00 while in the generated historical data is 15.00.00, maybe has something to do with this. Thanks
DeleteBut if I have generated the historical data with the first date in the transaction with time default of 0.00.00, then I change the time of first date in transaction to like 9.00.00 then without regenerating the historical data, I generate the evolution, it works. But if I delete and regenerate the historical data, the data still -1 day. I think we need to review the script just a little. please advice.
DeleteI temporary solved it by placing dummy date (-1 day) in transaction sheet without any amount. if you have better solution please let me know.
Delete"I followed your suggestion,"
Delete=> The timezone of your spreadsheet is now Indonesian timezone?
"when I run the evolution script, first date appeared to be missing and only shows the repetition of the table header,"
=> You mean that you have the header row repeated 2 times?
Can you tell the symbols of some stocks that you are using? I'll do some tests with them
IDX:PTBA, yes I have changed it to Indonesian time zone, yes I ran the evolution script, header repeated.
DeletePak parindra, ini setelah juli datanya kacau ga buat yang Evolution pake data composite:idx? Ada solusinya kah? klo ada boleh di share?
DeleteI just noticed that the last Portfolio Value in the Evolution sheet is not the same as in Overview, any explanation?
ReplyDeleteFor me the last row in the evolution is very different with the summary in the Overview, it should be the same, I did some check and the problem is still with the time zone, one day transaction in Evolution sheet takes more than one day of transaction history (day 1.5 days) this makes the cash flow incorrect. Can you help me to solve this problem, I think modification in evolution script is necessary, bring the time down to the hours/minutes. in indonesia, the trading time starts at 09.00 a.m ends at 03.30 p.m.
DeleteProblem solved, just set the hour same as the hour standard in evolution sheet. Thanks!
DeleteThe Evolution sheet relies on data in many historical price sheets.
DeleteFor example, the sheet EPA:CS contains the historical prices of the EPA:CS stock by using the formula =GOOGLEFINANCE("EPA:CS", "price", DATE(2017,12,27), TODAY(), "DAILY") on the cell A1
However, that formula does not always return data up-to-date. For example, as of today 14/06/2022, =GOOGLEFINANCE("EPA:CS", "price", DATE(2017,12,27), TODAY(), "DAILY") returns only prices until 10/06/2022. Consequently, the evolution sheet is computed only until 10/06/2022.
Whereas, in the Overview and Values sheets, it uses the formula =GOOGLEFINANCE("EPA:CS") that returns "realtime" price (delay 20 minutes normally).
In conclusion, there is chances that the last Portfolio Value in the Evolution sheet is not the same as in Overview because they are not on the same date.
Hi! Amazing job you did!! I´m trying to adapt it to my current situation but I´m having some troubles to include currency conversion. For example, I have some stocks in GBX which means that the price is multiplied by 100. Do you know where should I include this condition in the app script to have this variable included?? I found the section but I´m not getting the result that I expect...
ReplyDeleteHi, Thank you for your compliment about this stock portfolio tracker with Google Sheets that I shared. If you are trading only stocks in GBX and their prices returned by the GOOGLEFINANCE function in Google Sheets are multiplied by 100, I think the simplest way you can do is to adapt your transactions accordingly. By doing so, your transactions and the prices fetched with GOOGLEFINANCE are at the same unit and hence you don't need to modify other formulas and scripts. Otherwise, you need to find every location (both in formulas and scripts) and apply the necessary conversions. By the way, please note that my stock investment tracking template with Google Sheets and Google Data Studio does not support yet multiple currencies. If you find a solution for your problem, please share feedback here (if you don't mind) so that other readers can benefit from it. Thank you!
DeleteHey, Great work on this tracker, it really help me. I have question, Is there any chance that I can change the data source from GOOGLEFINANCE to another source (e.g. Yahoo Finance) because i found out GoogleFinance stop creating log after July 1th 2022 (i dont know why) and then the data after would be the present date. It makes our data goes flat (unchanged). Thank you.
ReplyDeleteYes I think it is possible. Where do you get the information about GoogleFinance stop creating log after July 1th 2022? It still works for me as far as I know.
DeleteGoogleFinance stop creating log after July 1st 2022 on Indonesian market, if u curious about it u can check it by yourself. So basically, the googlefinance data of indonesia market only have log until July 1st or 2nd 2022 and after that followed only realtime market, e.g. if u want to check price for Sept 19th 2022, the sequence would be 30th June 2022- July 1st - Sept 19th 2022, not the usual sequence ( I prolly can confirmed this case only happened on Indonesia Market). So if i want to pull data from the yahoo finance, I only change the formula or also the script? Also another sugestion/questions is Can you create another page, that show us the progress of our portfolio in any given time? Like quarterly or YTD? I totally still clueless about this kind of thing cuz im totally new to this. Thank you.
DeleteHow can I add mutual funds like LU0996182563?
ReplyDeleteHi Laura, thanks for following this tutorial about creating stock investment tracker with Google Sheets. For your question, what is the symbol for LU0996182563 that is recognized by the GOOGLEFINANCE function in Google Sheets?
DeleteHow do you manage BONUS shares which you get free of cost by the company ? e.g. for every 10 shares you get 1 free shares .
ReplyDeleteTo keep it simple, I register the bonus shares in a BUY transaction where the amount for this transaction is 0 because I get them for free.
DeleteIf you want, you can also define a new type of transaction, for instance, BONUS, for this kind of transactions. You need then add some modifications to the stock portfolio investment tracker.
This comment has been removed by the author.
DeleteOK great and what about DEMERGER of companies. Are they also a similar case where some value gets unlocked from the parent company and awarded as a set of shares of new company ? Normally a demerger causes a reduction of value of stock price by the amount of launch price of the new company stock. how will that be handled here ? e.g. The stock price of the Company ABC before Demerger was lets say 2153 on day of demerger but post merger the amount gets reduced by 100 and makes it 2053
DeleteDate Corp Action Type Symbol Qty Share Price Value
01-08-2024 DeMerger Stocks ABC 10 2050 20500
01-08-2024 DeMerger (New) Stocks ABC-1 10 100 1000
In the case of a DEMERGER, if the share quantity for the old company remains unchanged, I believe there's nothing additional to manage—it's similar to a DIVIDEND transaction where the stock price drops after the payout.
DeleteFor the new company, you can view it as a BUY transaction where you receive some shares at no cost.
Once again, my suggestion is just to try to keep the ledger simple.
However, it's entirely possible to create new transaction types to accommodate your requirements.
Hey, you can find your solution here. This was a reply by developer for the same question.
ReplyDeleteHi,
Thank you for your feed back. Yes, you're right about the "Unknown" on the Original Data Source side. I also see that if I use a different Google account to make a copy. I look into it to improve the guide.
Can you try to make a another copy, and select your sources in the order (top to bottom): Overview, Evolutions, Values, Transactions, Benchmarks, Buy-Sell Evaluation?
Thanks.