Stock Correlation Analysis With Google Sheets
Correlation is a statistical relationship that measures how related the movement of one variable is compared to another variable. For example, stock prices fluctuate over time and are correlated accordingly or inversely to one another. Understanding stock correlation and being able to perform analysis are very helpful in managing a stock portfolio investment. In this post, I explain in details how to perform correlation analysis among stocks in Google Sheets.

Table of Contents
Understanding correlation and its applications in stock investing
The most familiar correlation measure is the Pearson product-moment correlation coefficient. The strength of the relationship between two variables is expressed numerically between -1 and 1. For example:
- Two stocks are positively correlated when their prices always go up or go down together. Their coefficient is between (0, 1].
- Two stocks are negatively correlated when one's price goes up while the other goes down or vice versa. Their coefficient is between [-1, 0).
- Two stocks are uncorrelated if their prices fluctuate independently of each other. Their coefficient is then 0.
In stock investing, from the historical prices of stocks, investors can compute the correlations between them in the past and predict their relationships in the future. Such as:
- Based on historical correlations of one stock with a market index or a commodity in terms of price, an investor might predict whether the stock will go up or go down in response to a change related to the index or the commodity.
- Based on historical correlations of stocks, an investor might reduce risk by diversifying a portfolio with stocks that are not highly correlated.
Stock correlation analysis with Google Sheets
As suggested by the Pearson product-moment formula, to compute the correlation coefficient between two stocks, here are what I need to do:
- Choose a date range to retrieve historical prices of the two stocks
- Retrieve historical prices of the two stocks
- Apply the dataset to the Pearson product-moment formula
Those steps are exactly what Google Sheets has to offer:
- GOOGLEFINANCE function fetches current or historical securities information from Google Finance.
- CORREL function calculates r, the Pearson product-moment correlation coefficient of a dataset.
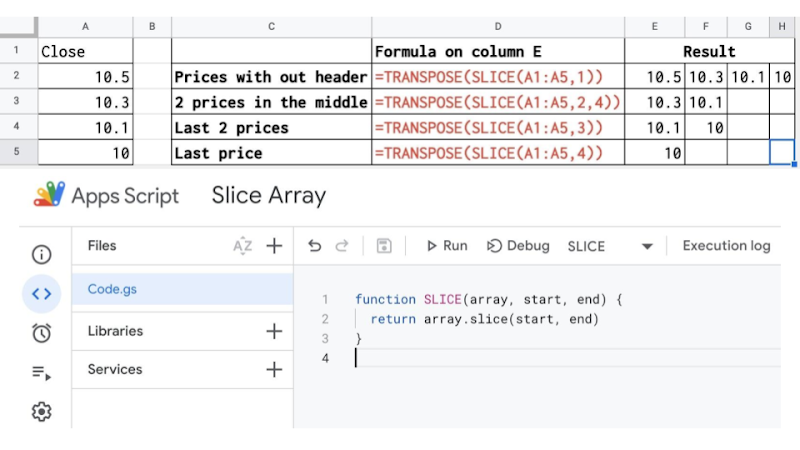
- And most importantly, with the scripting capability offered by Google Apps Script, I can compute easily correlations between more than two stocks, which is important if I want to apply them to diversify a stock portfolio.
Finally, here is the step by step of how to use Google Sheets to perform stock correlation analysis:
- Define a list of stocks
- Define a time period for historical prices of stocks
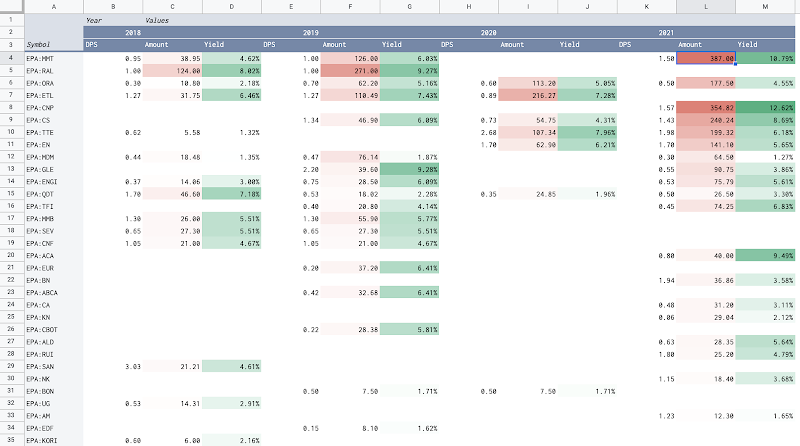
- Use the GOOGLEFINANCE function to fetch historical prices of the stocks during the defined time period
- Use the CORREL function to compute the correlation coefficient for every two stocks in the list
- Present all computed correlation coefficients in form of a matrix. The matrix is very good visualization support to present correlations between many stocks (more than two). It can enable the comparison of the strength between a pair of stocks relative to other pairs.
- The header row and header column of the matrix contain symbols of stocks.
- Each cell in the matrix is a coefficient between 2 stocks, the one in the header row and the one in the header column of that cell.
- Apply color scale conditional formatting on the matrix to better visualize the strength of the relationships between the stocks
- Sort the matrix by a selected stock to identify clusters that are highly correlated (positively or negatively)
- Draw conclusions from the matrix visualization
Getting started
I have made available a spreadsheet in Google Sheets to perform stock correlation analysis. You can follow the steps below to getting started with it.
- Make a copy of the demo spreadsheet: how to perform correlation analysis in Google Sheets
- Create a sheet that contains stocks you want to perform correlations analysis. The sheet must contain 2 columns: Symbol and Name as same as the sample sheets CAC 40, Dow Jones, SP500 ETFs, and My Portfolio. You can name the sheet whatever you want. Please note that symbols must be recognizable by the GOOGLEFINANCE function.
- Define parameters of the analysis in the Configuration sheet. The required parameters are:
- Stocks Sheet Name
- Historical Prices Start Date
- Historical Prices End Date
- Historical Prices Interval
- Sort Correlation Matrix By Symbol
- Through the items in the menu Stock Correlation Analysis, perform the steps below in order:
- 0 Clear current analysis
- 1 Generate Historical Prices Sheets
- 2 Generate Correlation Price Data Sheet
- 3 Generate Correlation Data Sheet
- 4 Generate Correlation Matrix Sheet
User guide
- The Configuration sheet contains all parameters for the analysis, such as time period, list of stocks, colors for conditional formatting the correlations matrix, etc. You can find directly in the sheet description for each parameter.

- The Correlation Price Data sheet contains all historical prices of all stocks during the defined time period.
- The Correlation Data sheet contains all correlation coefficients that are results of applying the CORREL function on the dataset in the Correlation Price Data sheet.
- The Correlation Matrix sheet visualizes correlation coefficients in form of a matrix with an eye-catching conditional format. The last column in the matrix is reserved for the average of correlation coefficients of stock in the header column vis-a-vis the other stocks. The visualization of the matrix is fully customizable via the parameters in the Configuration sheet.
- You can choose different colors for the color scale of the matrix.
- You can choose between Name or Symbol of stocks to display in the header row and the header column of the matrix.
- You can choose how the matrix is sorted to reveal interesting clusters.
- The ready-to-use script helps to do steps of correlation analysis efficiently. The script will add automatically the Stock Correlation Analysis menu to the spreadsheet on opening. It is convenient so that you can execute the commands directly from the spreadsheet user interface. The menu contains all the main steps necessary to perform an analysis.
- 0. Clear current analysis: It will delete all the historical prices sheets that were generated as well as the 3 sheets: Correlation Price Data, Correlation Data, and Correlation Matrix. You should run this command only if you want to perform the correlations analysis on a new list of stocks.
- 1. Generate Historical Prices Sheets: It will create each historical prices sheet for each stock. Those historical prices sheets are hidden automatically as I rarely need to look at them.
- 2. Generate Correlation Price Data Sheet: It will aggregate all historical prices sheets above into the Correlation Price Data sheet. I need to do so to facilitate the calculation of correlation coefficients between many stocks.
- 3. Generate Correlation Data Sheet: It will compute the correlation coefficient for each pair of stocks and put them all into the Correlation Data sheet.
- 4. Generate Correlation Matrix Sheet: Il will present the coefficients in the Correlation Data sheet in form of a matrix. The matrix is formatting with parameters defined in the Configuration sheet.
Most of the time, you only need to define a list of stocks that you want to perform correlation analysis on them and change parameters in the Configuration to reveal insight between stocks.
Note: If the number of stocks is large, it might cause some delays on the spreadsheet. In this case, you can wait for the script finished or refresh the spreadsheet and retry.
Conclusion
Understanding stock correlation and being able to perform analysis are very helpful in managing a stock portfolio investment. This post explains in detail how to perform correlation analysis among stocks in Google Sheets.
Disclaimer
The post is only for informational purposes and not for trading purposes or financial advice.
Feedback
If you have any feedback, question, or request please:
- leave a comment in the comment section
- write me an email to allstacksdeveloper@gmail.com
Support this blog
If you value my work, please support me with as little as a cup of coffee! I appreciate it. Thank you!

Share with your friends
If you read it this far, I hope you have enjoyed the content of this post. If you like it, share it with your friends!


Comments
Post a Comment