Demo stock investment portfolio tracker with Google Data Studio
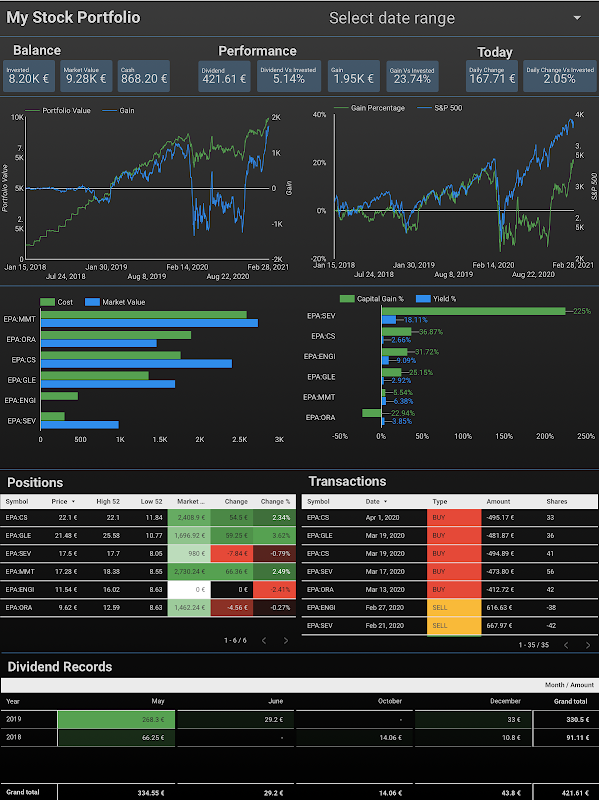
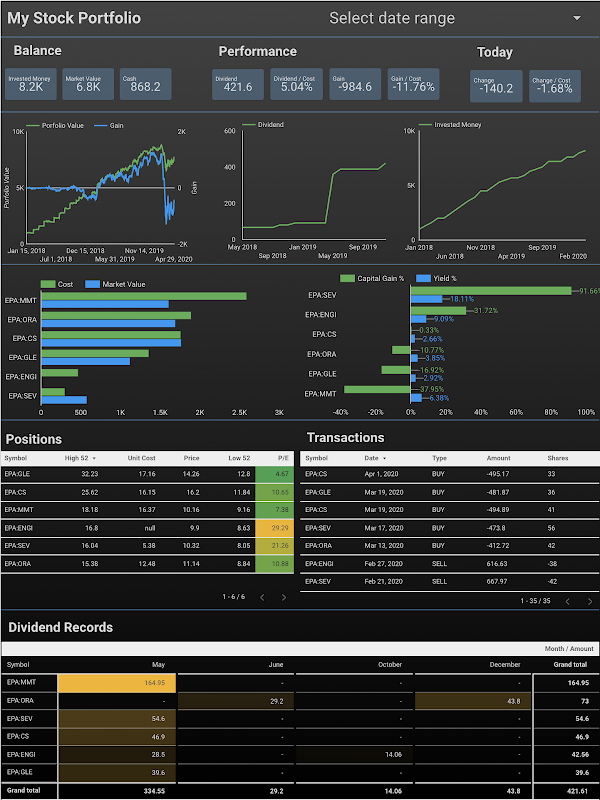
As explained in the post Create personal stock portfolio tracker with Google Sheets and Google Data Studio, a personal stock portfolio tracker consists of 2 main elements: a spreadsheet in Google Sheets and an interactive dashboard in Google Data Studio. The dashboard below is built with Google Data Studio and visualizes data stored in the spreadsheet that can be found in the post Demo stock portfolio tracker with Google Sheets.
The dashboard below is not an image, it is a real one and is interactive. You can change some filters to see data from a different perspective. For instance, you can change the date range or select a particular stock.
NOTE: An enhanced version was published at Create personal stock portfolio tracker with Google Sheets and Google Data Studio.

Table of Contents
Note
To better understand the overall concept, please check out this post Create personal stock portfolio tracker with Google Sheets and Google Data Studio.
Disclaimer
The post is only for informational purposes and not for trading purposes or financial advice.
Feedback
If you have any feedback, question, or request please:
- leave a comment in the comment section
- write me an email to allstacksdeveloper@gmail.com
Support this blog
If you value my work, please support me with as little as a cup of coffee! I appreciate it. Thank you!
Share with your friends
If you read it this far, I hope you have enjoyed the content of this post. If you like it, share it with your friends!




Comments
Post a Comment