Compute cost basis of stocks with FIFO method in Google Sheets
After selling a portion of my holdings in a stock, the cost basis for the remain shares of that stock in my portfolio is not simply the sum of all transactions. When selling, I need to decide which shares I want to sell. One of the most common accounting methods is FIFO (first in, first out), meaning that the shares I bought earliest will be the shares I sell first.
As you might already know, I use Google Sheets extensively to manage my stock portfolio investment, but, at the moment of writing this post, I find that Google Sheets does not provide a built-in formula for FIFO. Luckily, with lots of effort, I succeeded in building my own FIFO solution in Google Sheets, and I want to share it on this blog.
In this post, I explain how to implement FIFO method in Google Sheets to compute cost basis in stocks investing.

Table of Contents
If my work has been helpful to you 🙏

FIFO example
Firstly, I present an FIFO example to clarify the concept of this method and to use it later as test case for my FIFO formula.
Let's assume that I have bought and sold several time stocks of TotalEnergies SE (EPA:TTE). The table below presents my transactions for TotalEnergies stock.
| Date | Type | Symbol | Amount | Shares |
|---|---|---|---|---|
| 26/11/2021 | BUY | EPA:TTE | -494.26 | 12 |
| 19/08/2021 | BUY | EPA:TTE | -404.09 | 11 |
| 30/04/2021 | BUY | EPA:TTE | -479.55 | 13 |
| 23/03/2021 | BUY | EPA:TTE | -477.17 | 12 |
| 05/02/2021 | BUY | EPA:TTE | -499.99 | 14 |
| 07/10/2020 | BUY | EPA:TTE | -496.47 | 17 |
| 18/09/2020 | BUY | EPA:TTE | -474.85 | 15 |
| 06/07/2020 | BUY | EPA:TTE | -57.60 | 2 |
| 04/05/2020 | BUY | EPA:TTE | -489.85 | 16 |
| 02/04/2020 | SELL | EPA:TTE | 483.76 | -13 |
| 24/03/2020 | SELL | EPA:TTE | 482.51 | -17 |
| 18/03/2020 | BUY | EPA:TTE | -479.42 | 20 |
| 12/03/2020 | BUY | EPA:TTE | -476.35 | 17 |
| 24/02/2020 | BUY | EPA:TTE | -471.44 | 11 |
| 03/10/2019 | BUY | EPA:TTE | -497.70 | 11 |
| 09/05/2018 | SELL | EPA:TTE | 468.35 | -9 |
| 02/02/2018 | BUY | EPA:TTE | -421.80 | 9 |
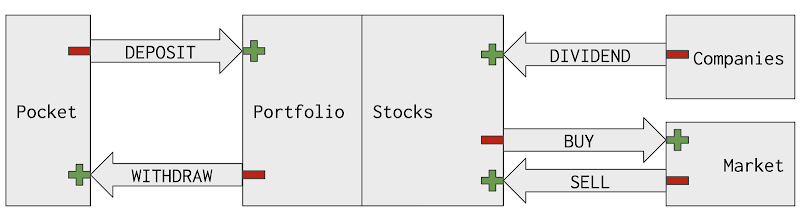
I use a spreadsheet on Google Sheets to keep track of my stock portfolio's transactions. I insert a new transaction into the spreadsheet whenever I deposit money, withdraw money, use deposited money to buy stocks, receive money by selling stocks, and receive dividends by holding stocks. Each transaction is a row containing information about Date, Type, Symbol, Amount and Shares of that transaction. For further details, you should read my post Manage stock transactions with Google Sheets.
If I use the average method, dividing the total amount (4785.92 €) by the total number of shares (141), the unit cost for TotalEnergies stock in my portfolio is: 4785.92 / 141 = 33.94 €. However, in this case, the shares I bought first always have an impact on my current unit cost. This might raise some issues, especially in the case of long-term investment during which a stock can have a significant price change and I make many transactions (BUY and SELL) on that stock.
If I apply the FIFO accounting method, the shares I bought earliest will be the shares I sell first and the sold shares will not have any more impact on my current unit cost price. The table below shows the result of applying FIFO accounting method after each transaction. In this case, my current unit cost is actually 4605.44 / 141 = 32.66 € that is better than 33.94 € with the everage method above. Why that? That's because I have made some losses on some transactions but those losses are closed up and will not show up in the current situation.
| Date | Type | Symbol | Amount | Shares | Remaining shares | Cost of remaining | Cost of sold | Realized gain |
|---|---|---|---|---|---|---|---|---|
| 26/11/2021 | BUY | EPA:TTE | -494.26 | 12 | 141 | 4,605.44 | 0.00 | |
| 19/08/2021 | BUY | EPA:TTE | -404.09 | 11 | 129 | 4,111.18 | 0.00 | |
| 30/04/2021 | BUY | EPA:TTE | -479.55 | 13 | 118 | 3,707.09 | 0.00 | |
| 23/03/2021 | BUY | EPA:TTE | -477.17 | 12 | 105 | 3,227.54 | 0.00 | |
| 05/02/2021 | BUY | EPA:TTE | -499.99 | 14 | 93 | 2,750.37 | 0.00 | |
| 07/10/2020 | BUY | EPA:TTE | -496.47 | 17 | 79 | 2,250.38 | 0.00 | |
| 18/09/2020 | BUY | EPA:TTE | -474.85 | 15 | 62 | 1,753.91 | 0.00 | |
| 06/07/2020 | BUY | EPA:TTE | -57.6 | 2 | 47 | 1,279.06 | 0.00 | |
| 04/05/2020 | BUY | EPA:TTE | -489.85 | 16 | 45 | 1,221.46 | 0.00 | |
| 02/04/2020 | SELL | EPA:TTE | 483.76 | -13 | 29 | 731.61 | 438.46 | 45.30 |
| 24/03/2020 | SELL | EPA:TTE | 482.51 | -17 | 42 | 1,170.06 | 754.85 | -272.34 |
| 18/03/2020 | BUY | EPA:TTE | -479.42 | 20 | 59 | 1,924.91 | 0.00 | |
| 12/03/2020 | BUY | EPA:TTE | -476.35 | 17 | 39 | 1,445.49 | 0.00 | |
| 24/02/2020 | BUY | EPA:TTE | -471.44 | 11 | 22 | 969.14 | 0.00 | |
| 03/10/2019 | BUY | EPA:TTE | -497.7 | 11 | 11 | 497.70 | 0.00 | |
| 09/05/2018 | SELL | EPA:TTE | 468.35 | -9 | 0 | 0.00 | 421.80 | 46.55 |
| 02/02/2018 | BUY | EPA:TTE | -421.8 | 9 | 9 | 421.80 | 0.00 |
On the 02/02/2018, I bought 9 shares of TotalEnergies SE (EPA:TTE) then sold them all on 09/05/2018. After these 2 transactions, it's straightforward that I didn't own any more the stock and the cost of sold for 9 shares were exactly the amount that I bought them from the first place.
From 03/10/2019 until 18/03/2020, I bought 4 times shares of TotalEnergies SE (EPA:TTE) at 4 different prices (45.25 €; 42.86 €; 28.02 €; 23.97€). The cost of remaining after each of these transactions does not involve the first 2 transactions because they were closed up with the FIFO method. After the 4 BUY transactions, I had 59 shares at the cost of 1924.91€ that are both the sums of the 4 transactions.
On the 24/03/2020, I sold a 17 shares of TotalEnergies SE (EPA:TTE) but at how much cost? By applying the FIFO method, I break down the 17 shares into 2 groups:
- The first 11 shares belong to the BUY transaction on the 03/10/2019, therefore, it costs me 497.70
- The next 6 shares belong to the BUY transaction on the 24/02/2020, therefore, it costs me 471.44 / 11 * 6 = 257.15€
- Totally, the 17 shares costs me 497.70 + 257.15 = 754.85€
-
After this sale, I still had 59 - 17 = 42 shares, of which
- 5 shares were bought on 24/02/2020 for total of 471.44 / 11 * 5 = 214.29€
- 17 shares were bought on 12/03/2020 for total of 476.35€
- 20 shares were bought on 18/03/2020 for total of 479.42€
- Totally, the 42 shares remaining costs me 1170.06€
By following the same analysis with FIFO method, I can compute all the remaining quantities, cost of remaining, cost of sold, etc. after every transaction.
How to do FIFO in Google Sheets
At the moment of writing this post, I find that Google Sheets does not support an out-of-the-box formula for FIFO accounting. However, with Apps Script, it is possible to extend Google Sheets with new custom formulas. My rule of thumb when working with Google Sheets is that: what is not available by default, I will find a solution with Apps Script.
I write an Apps Script function named FIFO accepting 2 parameters:
- The first one is a list of amounts of transactions ordered by time ascending.
- The second is a list of quantities of transactions ordered by time ascending.
This FIFO functions returns:
- The remaining quantities after the last transaction
- The cost of remaining after the last transaction
- The cost of goods sold for the last transaction if it is a SELL transaction
In the world of programming, when we talk about FIFO, we think of a queue. In my FIFO implementation, I use a queue to store the unit costs of shares. Each element in the queue represents a share and each share is associated with its unit cost.
I iterate every transaction from the oldest to the latest:
- If it is a BUY transaction, I push shares to the back of the queue.
- If it is a SELL transaction, I remove shares at the front of the queue. The sum of all removed shares is actually the cost of goods sold for this SELL transaction.
At the end of the iteration:
- The length of the queue is actually the number of remaining shares.
- The sum of the queue is actually the cost of remaining.
*Notes
- Google Apps Script is actually JavaScript
- In JavaScript, we can use array to present a queue
- In case of FIFO, to remove an element from the beginning of an array, we use the shift() method
How to use FIFO formula in Google Sheets
This FIFO function written in Apps Script is available for use in Google Sheets as same as any other built-in formulas.
Simple usage
Here is how I use the FIFO formula in Google Sheets for the first 2 transactions 02/02/2018 and 09/05/2018.
=FIFO({-421.8;468.35},{9;-9})
Here is how I use the FIFO formula in Google Sheets for the first 7 transactions from 02/02/2018 until 24/03/2020.
=FIFO({-421.8;468.35;-497.7;-471.44;-476.35;-479.42;482.51},{9;-9;11;11;17;20;-17})
If I have the amounts on column D and the quantities on column E, both already ordered ascending by time, I can use the FIFO formula in Google Sheets as:
=FIFO(D2:D10, E2:E10)
Use FIFO with QUERY formula
As I have a dedicated Transactions sheet for registering my transactions, I can apply the FIFO method for any stock on any specific date by combining it with the QUERY formula.
The idea is to use the QUERY formula to extract transactions by stock and by date, then sort them ascending by time.
Here is an example of using the FIFO formula with the QUERY formula in Google Sheets:
=FIFO(QUERY(Transactions!A:E,"select D where C='EPA:CS' and B!='DIVIDEND' and A <= date '2020-03-24' order by A asc",0),QUERY(Transactions!A:E,"select E where C='EPA:CS' and B!='DIVIDEND' and A <= date '2020-03-24' order by A asc",0))
Demo

Conclusion
In this post, I have explained how to apply FIFO formula in Google Sheets to compute cost basis of a stock portfolio investment. The process involves writing the FIFO function with Apps Script and then use it as a normal formula in Google Sheets. The FIFO formula returns the remaining quantities, the cost of goods sold and the cost of remaining after the last transaction.
LIFO method
In addition to the FIFO (First In, First Out) method, there is also another accounting method named LIFO (Last In, First Out). If you are interested in the LIFO method in managing stock investment, please refer to my post Compute cost basis of stocks with LIFO method in Google Sheets
Disclaimer
The post is only for informational purposes and not for trading purposes or financial advice.


Go to Sheet3 and enter the formula =fifo(D2:D4,E2:E4) the remaining stock comes fine, but the cost of the 9 items sold is not showing up. As a result the FIFO calculation here is not correct when we apply to a large date range!
ReplyDeleteThank you for reading this post about how to use the FIFO method in Google Sheets and for taking the time to give me this feedback.
DeleteThere are two things here. Firstly, thanks to your feedback I realize that I have a mistake in presenting the result. In fact, the FIFO function returns 3 elements where the 1st one is the Remaining Quantities, the 2nd is the Cost of remaining, and the 3rd is the Cost of goods sold. In Sheet 3, rows 12 and 13, I misplaced the label Cost of goods sold with the label Cost of remaining. I just fixed that. The FIFO function itself works properly.
Secondly, the formula =fifo(D2:D4,E2:E4) will return 0 for The cost of goods sold. Why? Because as I explained in the post, the FIFO function returns the cost of goods sold for the last transaction if it is a SELL transaction. Here the transaction in row 4 is a BUY transaction. If you want to have the cost of goods sold for the 9 shares in the first 2 transactions, you should use the formula =fifo(D2:D3,E2:E3) instead.
I hope this answer gives you some clarification. Once again, thanks for the feedback.
This comment has been removed by the author.
ReplyDeleteI already share it in this blog post. You can find in the demo google spreadsheet the script for calculating FIFO capital gain of stock investment.
Deleteaha. I didn't know that duplicating the spreadsheet also gives me a copy of included apps script. Thanks for suggestion
DeleteThank you for sharing this sheet / script. I have been struggling to get something like this added to my tracker for awhile now and I am much closer now. I have run into one slight snag trying to use your script and I was wondering if you would be able to help me out or point me in the right direction.
ReplyDeleteYour script is working perfectly except that I am trying to track individual trades that are made on the same day at different prices. With your script it seems to require a unique trade for each day. If not, it will use the variables for the first trade of that day and use it for the rest of the trades made that day. Would it be difficult to update the script so that it would be able to factor in the time the trade was made as well as the date? If there are any resources you'd be able to point me to I would greatly appreciate it. Thanks again for sharing the work you've done here!
I was able to figure it out by using Datetime vs Date in the query. The next thing that would be helpful would be to reverse the order of the trades so the latest trades are at the bottom of the sheet.
DeleteMy FIFO function in Google Sheets does not look at the date-time of the transactions. As you can see, it requires only 2 parameters: a list of amounts and a list of quantities. And these 2 parameters must already present chronological order of the transactions. So if you want to apply FIFO function to your day trading activities, you just need to provide these 2 list in the chronological order. As I mentioned in this post and as you already found out, you can use the QUERY function to prepare these parameters for the FIFO function. To preserve the chronological order of the transactions, I use the statement ORDER BY 'date-time column' ASC in the QUERY function.
DeleteThank you for the response! I was able to get it working for my case.
DeleteThe only only issue I'm running into is the function re-running itself when it necessary. I am using the function on a lot of transactions I'm also adding new transactions to the sheet with a query because the automation I'm using to add the new data adds a new line and this seems to be the best way of not having to manually add the function. I'm assuming that the function re-running is triggered by the query refreshing, but I'm not entirely sure.
What seems like it would be helpful in my case would be to have the app first check if it has already run before running. I have spent some time attempting to solve this, but I'm striking out. Is there anything you could think of that wouldn't be too difficult to implement?
I think, as same as every function in Google Sheets, a custom FIFO function will recalculate itself when its arguments change. For instance, if you use the FIFO method in a cell in Google Sheets, like =FIFO(D2:D10, E2:E10), it is logical that whenever the range D2:D10 or E2:E10 is changed, the FIFO computation is triggered.
DeleteI suggest you verify your automation process to make sure that it does not modify the range (used by the FIFO function) when there isn't any new transaction. If your automation process does not change the range, the FIFO function will not be triggered for recalculating.
Hope that I understand your point and my suggestion is clear.
In my experience working with the function, it can be sensitive and will recalculate at times. I have found that if you have a lot of transactions and the calculation is occurring simultaneously and I believe this to be the culprit for some of the earlier issues I was experiencing. I solved this by sequencing the calculation for the transactions going from earliest to most recent. When there are thousands of transactions across 100+ symbols, it ends up being a slow process anytime it recalculates. The best solution I can think of is to have another app that will replace the formula with the static values after the calculation has been done. I'm currently doing this step manually and everything seems to be working much better.
DeleteDo you use this FIFO method on every of your transactions?
DeleteThanks so much for sharing this with us all, it's amazing work! I've got 2 questions though, if you wouldn't mind pointing me in the right direction that'd be amazing.
ReplyDelete1. If you are able to buy and sell partial shares, the current solution fails. This is because shares are rounded up to the nearest whole number, which is breaking the calculations for quantities and costs (0.5 becomes 1 for each transaction, which makes the problem grow with scale). I have had a look at the script to see where this rounding occurs, but had no such luck finding the root cause (I'm unfortunately quite new to Google App Scripts).
2. Do you have an alternative script available that calculates LIFO? It is common for FIFO and LIFO to both be used in investing, so having a script for each would help identify what method works best for calculating gain/loss, even if they both run simultaneously, and the user can see the difference between each result in a column.
Many thanks in advance!
Thank you very much for buying me coffees and I am glad that you appreciate my work on how to calculate cost basis of stocks with FIFO method in Google Sheets!
Delete1. Yes, the current solution does not support transactions with fractional shares. As I explained in the blog post, I use a queue to support the FIFO implementation. Each element in the queue represents a share and each share is associated with its unit cost. I am working on an enhanced version to support transactions with fractional shares. It would then be able to apply the FIFO method to calculate the cost basis of cryptocurrency investment.
2. Yes I have another version to calculate the cost basis of stocks with the LIFO method in Google Sheets. I will soon publish a blog post to explain it as same as this blog post. So please stay tuned!
Once again, thank you very much for buying me coffees!
Thanks so much for the speedy reply! That makes a lot of sense. I thought I might have been missing something, so it's nice to know I'm not crazy haha.
DeleteI imagine LIFO will be a shuffle of the FIFO code, which should be easier to accomplish in functionality, but do you have a rough idea on how far off you might be for the fractional share function? No rush or pressure of course, I'm just not smart enough to figure it out and this is the last piece to a puzzle for something I'm working on as well.
Enjoy your coffees, they're well deserved! :)
Chiming back in as I've found a way to do this via very long cell formulas, however, I'm still super keen to see how you get this to work as a Google App Script when it's ready. Thanks again!
DeleteHello,
Deletehow can I integrate LIFO method in my Google Sheet, and choose for each line if I want to use FIFO or LIFO method.
Example I usually use FIFO method for swing trading but when I have old positions already opened, if I take a new swing trading, I want to calculate my result with LIFO method.
Example : I have 100 TTE.PA actions since years. I buy 50 new actions Monday and sell them Friday, for this transaction, I want to use LIFO method which is more realist.
Thank you
Hi,
DeleteI just publish a new post about implementing LIFO (Last in, First Out) method in managing stock investment with Google Sheets.
https://www.allstacksdeveloper.com/2023/11/lifo-google-sheets-stock-investment.html
Please let me know your feedback!
This is a wonderful script and I've been able to adapt my transaction log to the format that should work with the FIFO script. However I run into a few issues. Often when I make a buy/sell, Interactive Brokers breaks this into multiple trades automatically with the same timestamp as some parts of the order get filled earlier than others. Sometimes these trades have the same date-timestamp as well. It seems that it struggles with multiple transactions on the same date/time (as mentioned above). The behaviour now is that for all transactions on the same date it shows the same "remaining shares", "cost of goods, etc." and therefore the numbers are off.
ReplyDeleteI haven't been able to come up with a solution as the timestamps are also the same. I've tried to play with RANK() and SEQUENCE() to give each transaction a unique number and filter on that in the query rather than data but so far I haven't succeeded. Any solutions to this?
Thank you for your compliment! I am so glad that you've been able to make this FIFO function in Google Sheets works with your stock investment. If it helps you, please support my blog with some coffee ☕️ ❤️!
DeleteFor your problem, my answers are:
- I made this FIFO function in Google Sheets mainly for tax declaration purposes and hence the level of aggregation by DAY would be sufficient.
- As I already answered to other reader, my FIFO function in Google Sheets does not look at the date-time of the transactions. As you can see, it requires only 2 parameters: a list of amounts and a list of quantities. And these 2 parameters must already present chronological order of the transactions.
Some suggestions:
- You can accept the level of aggregation by DAY. From your original transactions, you should group them by DAY and by SYMBOL into a new sheet. After that, you can apply the FIFO function on the new aggregated transactions.
- You can give each transaction a new column that represented its chronological order of execution. In the QUERY function, instead of ordering by DATE, you should order by the new column.
- In the QUERY function, you can try to order by DATETIME instead of only by DATE. But it will raises the same issue if 2 transactions happen at the same second.
Hope that helps you!
Hello thanks for your blog
ReplyDeleteVery interesting
I looked at Brad E. Dugdale III post and I also search to track intraday action.
Can you give me an exemple to query with datetime ?
Thank you
Hello,
DeleteYes of course!
Here is an simple example of using QUERY function to select transactions before a datetime with the precision up to SECOND:
=QUERY(A:E,"select A where A is not NULL and A <= datetime '2018-02-02 00:00:12' order by A asc")
Here is how I would use it with my FIFO function:
=TRANSPOSE(fifo(QUERY(A:E,"select D where A is not NULL and A <= datetime '"&TEXT(A2,"yyyy-MM-dd HH:mm:ss")&"' order by A asc",0),
QUERY(A:E,"select E where A is not NULL and A <= datetime '"&TEXT(A2,"yyyy-MM-dd HH:mm:ss")&"' order by A asc",0)))
For more details, you can checkout the new tab "FIFO Intraday Trading Example" on my demo spreadsheet "FIFO With Google Sheets". https://docs.google.com/spreadsheets/d/1uvjbKqTk9AMjov5MaDIK53AQOLodmc0KUqZ4SQdBYww/edit#gid=584663653
Hope that helps.
Thanks for reading.
AWESOME ! It's working.
DeleteThank you very much !!!
I'm very glad that worked for you!
DeleteMoreover, please note that if you have 2 or more transactions happened at the same SECOND, the formula will not work. In that case, you need to increase the precision to MILLISECOND. More details are available here https://developers.google.com/chart/interactive/docs/querylanguage#literals
If this blog helps you, please share and support it a coffee! Thank you!
This is very nicely written...thank you for doing this. I was able to implement using FIFO, LIFO, HIFO. Do you have a similar version in SQL?
ReplyDeleteHello TP, how do you add LIFO method ? Can you explain me ?
Deletethanks
Hi JP, I just publish a new post about implementing LIFO (Last in, First Out) method in managing stock investment with Google Sheets.
Deletehttps://www.allstacksdeveloper.com/2023/11/lifo-google-sheets-stock-investment.html
Please let me know your feedback!
Thank you for this fantastic script. Inspired by your work I did some improvements mainly to improve the speed and support fractional shares: https://gist.github.com/iassael/51b91e13a10e9383264041e2aa9b5b91
ReplyDeleteHi iassael, thank you so much for the feedback!
DeleteI looked at your implementation, and I found it very clever to design the inventory queue and for consuming that queue. In that way, your can effectively compute FIFO cost for transactions with fractional shares.
I have a remark related to the condition in the while loop for consuming the queue: I think instead of while (quantityToSell > 1), it should be while (quantityToSell > 0). Let me know what you think.
I put your solution (with the fix that I mentioned above) and a simple test case in this demo sheet. https://docs.google.com/spreadsheets/d/1uvjbKqTk9AMjov5MaDIK53AQOLodmc0KUqZ4SQdBYww/edit#gid=753829539
Thanks!
Fantastic catch! Thank you, I've updated the gist.
DeleteThanks to both of you for the fantastic function for FIFO tracking of fractional shares! One small issue surfaces when the remaining inventory is <1 share. The 'AvgBuyPrice' reflects the cost of the fractional share vs cost of a full share. For now, I added a helper column to calculate the AvgBuyPrice when the scenario presents (i.e. and shows the "AvgBuyPrice" in other situations) It's not elegant, but works with minimal overhead. I'll browse the script when I have more time, but curious if others have seen this?
DeleteHi - This is superb, I could use this for my stock portfolio easily. Thank you.
ReplyDeleteHad a question - can this fifo function loop through different stock symbol? I have a transaction data with different stocks. Currently, I am using fifo formula individually for each stock.
I had the same initial reaction, but solved it by replacing the Query function's data range with a filtered data set (e.g. filter(A:F,A:A=A2) where column A is the ticker symbol.
DeleteBeing lazy, my next goal is to wrap the FIFO function in an ARRAYFORMULA looking for non-blank cells in the transaction data range.
Hello,
DeleteYes! This FIFO function in Google Sheets does not require you to provide the stock symbol!. In fact, as explained in the article, the FIFO function in Google Sheets accepts 2 parameters:
- The first one is a list of amounts of transactions ordered by time ascending.
- The second is a list of quantities of transactions ordered by time ascending.
So if your list of transactions concern different stocks, it will certainly work as same as if they concern only one stock.
Just out of curiosity, in which case do you need apply FIFO function on different stocks?
Thank you for reading my investment blog
Hello, i also want how we can add function like this sheet calculated different stocks in same list. Currently assume i buy and sell 100 stocks, so i have to make 100 pages ready for each stock. It will be great if you can somehoe ass stock symbol in your calculations.
ReplyDeleteHi,
DeleteI want to keep the FIFO function in Google Sheets as much generic as possible so it can be used in others scenarios not only in the stock investment case.
As explained in the article, you can combine the FIFO function with others functions available in the Google Sheets to make the most out of them for tracking your investment.
For example, you can combine with the QUERY formula to extract transactions by stock and by date, then sort them ascending by time.
Here is an example of using the FIFO formula with the QUERY formula in Google Sheets:
=FIFO(QUERY(Transactions!A:E,"select D where C='EPA:CS' and B!='DIVIDEND' and A <= date '2020-03-24' order by A asc",0),QUERY(Transactions!A:E,"select E where C='EPA:CS' and B!='DIVIDEND' and A <= date '2020-03-24' order by A asc",0))
Hello! Thank you for the article. I used the data from the article and wrote a formula that gives the same result as FIFO. I was interested in solving this problem.
ReplyDeleteI didn't want to write it myself, but all the results led me to solutions through App Script, but I thought it was redundant.
I'm sharing my solution.
D - Amount
E - Shares
=SUM(QUERY(
FLATTEN(ARRAYFORMULA(IF(E2:E>0; SPLIT(REPT(ABS(D2:D)/E2:E&"|";ABS(E2:E)); "|"); "")));
"select * where Col1 is not null LIMIT "&SUM(E2:E)
))/SUM(E2:E)
Hi! Fractional shares version/update ready yet? Need this feature for my purposes. Thanks for your work!
ReplyDelete