Create personal stock portfolio tracker with Google Sheets and Google Data Studio
I have been investing in the stock market for a while. I was looking for a software tool that could help me better manage my portfolio, but, could not find one that satisfied my needs.
One day, I discovered that the Google Sheets application has a built-in function called GOOGLEFINANCE which fetches current or historical prices of stocks into spreadsheets. So I thought it is totally possible to build my own personal portfolio tracker with Google Sheets. I can register my transactions in a sheet and use the pivot table, built-in functions such as GOOGLEFINANCE, and Apps Script to automate the computation for daily evolutions of my portfolio as well as the current position for each stock in my portfolio.
I then drew some sort of charts within the spreadsheet to have some visual ideas of my portfolio. However, I quickly found it inconvenient to have the charts overlapped the table and to switch back and forth among sheets in the spreadsheet. That's when I came to know the existence of another Google product named Google Data Studio which I believed was the solution to my problem. Google Data Studio provides a built-in connector to Google Sheets to fetch data stored in spreadsheets and a powerful reporting tool to visualize those data into an interactive and beautiful dashboard.
So by combining Google Sheets and Google Data Studio, I can build a free, easy, interactive, beautiful, real-time, no-installation-needed, and personal stock portfolio tracker!

Table of Contents
Concept
The idea is to take advantage of what is offered for free by Google Sheets, Google Apps Script, and Google Data Studio and pull them together to build a personal but powerful stock portfolio tracker. We can think of a spreadsheet as a database to keep track of transactions made within a stock portfolio. To track the portfolio's evolution, we need to know the daily prices of holding stocks and that is exactly what is offered by the GOOGLEFINANCE function. We can then use Google Data Studio to build a beautiful and interactive dashboard based on data from the spreadsheet. To save our time, we can go on to write a small script in Google Apps Script to automate some repeated tasks such as computing daily changes of the portfolio.

The picture above gives an overview about the relationship among building elements of the personal stock portfolio tracker:
- The Transactions sheet is the input.
- The Positions and Evolutions sheets are computed with data from Transactions sheet and GOOGLEFINANCE built-in function. The computation can be as simple as applying some pivot tables or built-in functions of Google Sheet. It can also be more complicated but more powerful and automated by writing a little script with Google Apps Script.
- The Positions and Evolutions sheets are also refresh based on results returned from GOOGLEFINANCE, generally 20 minutes delay.
- The 3 sheets are connected as data sources to the dashboard in Google Data Studio
- The dashboard is refreshed regularly or manually by clicking on the refresh button to fetch new data from the spreadsheet
Demo
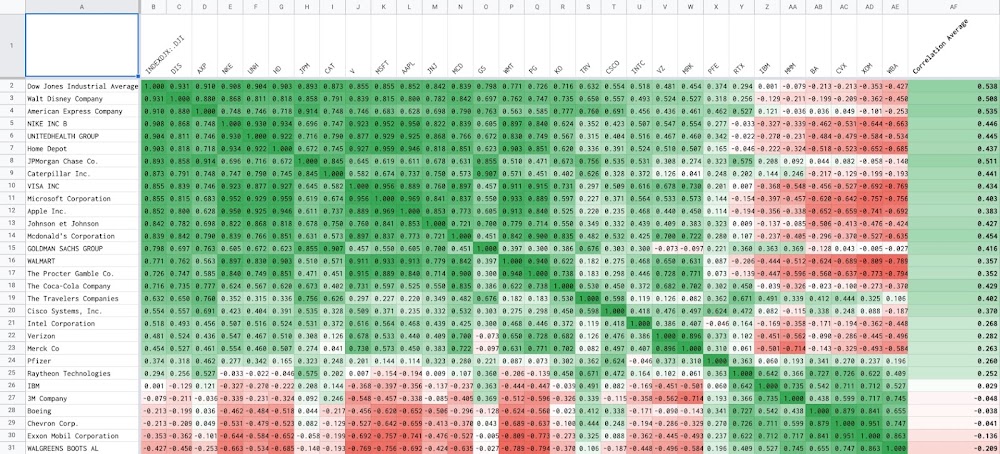
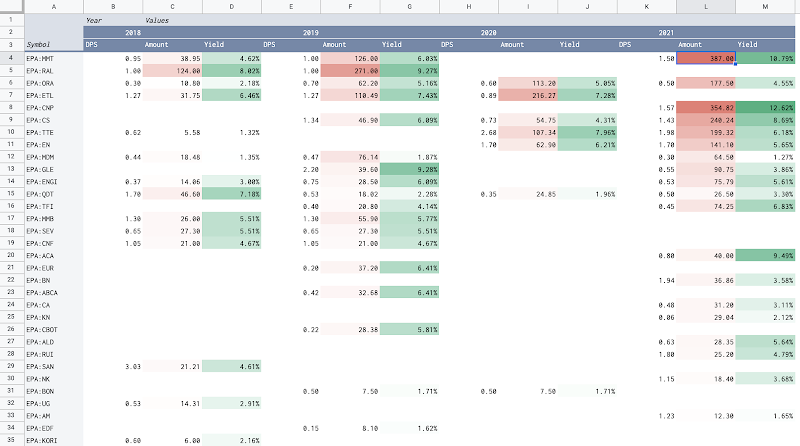
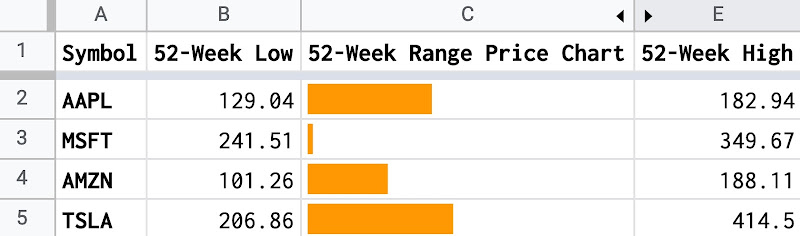
You can take a look at the sample spreadsheet below to have an idea of how the data is organized and related. It is possible to make a copy of the spreadsheet to study it thoroughly.
The dashboard in Google Data Studio visualizes data stored in the spreadsheet. It is interactive which means you can change some filters to see data from a different perspective. For instance, you can change the date range or select a particular stock.
- Sample sheet for tracking transactions, positions and evolutions of a stock portfolio
- Interactive dashboard for monitoring a stock portfolio
Guides
In the series of posts, I share with you step-by-step how to make your personal stock portfolio tracker with Google Sheets and Google Data Studio. Please read the posts below:
- Manage Transactions with Google Sheets
- Monitor stock portfolio with Google Sheets (Pivot table and GOOGLEFINANCE function)
- Compute daily evolutions of a stock portfolio with Google Sheets and Apps Script
- Create stock portfolio tracker dashboard with Google Data Studio
- Compare stock portfolio to market indexes
TLDR
UPDATE: You can skip this tutorial and go directly to LION stock portfolio tracker, which is an enhanced version.
Follow the steps below to quickly make your copy version of the spreadsheet and the dashboard:
- Sign in to your Google account in your browser
- Make a copy of this Google spreadsheet: Sample Portfolio spreadsheet
- Follow the section TLDR of the post Compute daily evolutions of a stock portfolio with Google Sheets and Apps Script to add the script to Apps Script and triggers to automate the computation for daily evolutions of the portfolio.
- Go to the tab Data sources on your Google Data Studio home page
- Create the data sources Transactions, Positions, Evolutions, Overview corresponding to the sheets of the same name on the copied Sample Portfolio spreadsheet.
- Go to this Sample Portfolio report and make a copy of the report.
- In the data sources configuration dialog, select the new data source corresponding to the original data source by matching their names.
- DONE! Add your own transactions and refresh the dashboard

Note
Some assumptions, definitions, or indicators made through this example are from my own experiences so I can totally understand if you might not agree with all of them. The purpose of this series is to introduce you to the possibility of building a personal stock portfolio tracker with Google Sheets and Google Data Studio. Once you get familiar with these applications, you can effectively define your own assumptions, definitions, or indicators that suit well your investment strategy.
References
Disclaimer
The post is only for informational purposes and not for trading purposes or financial advice.
Feedback
If you have any feedback, question, or request please:
- leave a comment in the comment section
- write me an email to allstacksdeveloper@gmail.com
Support this blog
If you value my work, please support me with as little as a cup of coffee! I appreciate it. Thank you!

Share with your friends
If you read it this far, I hope you have enjoyed the content of this post. If you like it, share it with your friends!


Hello,
ReplyDeleteI love your sheet and data concept and try to use your way managed my portfolio
But I have a problem, how Can I make "evolution sheet" ? I can't figure out how it work.
Hi,
DeleteSame here, I also do not understand how to make Evolution Sheet. If it's manual work then it's very hard to update on timely wise.
Do you get any solution? Please update if you find any solution for Evolution Sheet.
Thanks.
Hi,
DeleteI write a small google app script to generate the evolution of portfolio every day automatically after the market closes.
I had plan to write another post to show how it is done but had not yet published it.
Hi ,
DeleteWaiting for Evolution sheet Solution as said in Above comments , Really good work you have done in this I liked it , hope you will do more like this for Ulip plans Funds also if possible , Good work Keep it up
I have published LION stock portfolio tracker. Don't forget to check it out here https://www.allstacksdeveloper.com/p/lion-stock-portfolio-tracker.html
DeleteWould you know how to make a scorecard on studiodata with the difference gain percentage between the first day of the date range and the last day?
ReplyDeleteI don't think it's possible directly within google data studio. Unless, you compute that gain percentage in a sheet, then use that sheet as the datasource for a scorecard, then display that value on the scorecard.
Delete